
|
Mimedx Group ، Inc. (MDXG) DCF تقييم |
Fully Editable: Tailor To Your Needs In Excel Or Sheets
Professional Design: Trusted, Industry-Standard Templates
Investor-Approved Valuation Models
MAC/PC Compatible, Fully Unlocked
No Expertise Is Needed; Easy To Follow
MiMedx Group, Inc. (MDXG) Bundle
هل تتطلع إلى تقييم القيمة الجوهرية لشركة Mimedx Group ، Inc.؟ يدمج حاسبة MDXG DCF الخاصة بنا بيانات العالم الحقيقي مع ميزات تخصيص واسعة ، مما يتيح لك تحسين توقعاتك وتعزيز استراتيجيات الاستثمار الخاصة بك.
What You Will Receive
- Pre-Filled Financial Model: MiMedx Group’s actual data facilitates accurate DCF valuation.
- Comprehensive Forecast Control: Modify revenue growth, profit margins, WACC, and other essential parameters.
- Real-Time Calculations: Automatic updates provide immediate feedback as you adjust inputs.
- Professional-Grade Template: A polished Excel file crafted for high-quality valuation.
- Flexible and Reusable: Designed for adaptability, allowing for repeated use in detailed forecasting.
Key Features
- Customizable Financial Inputs: Adjust essential parameters such as revenue growth, gross margin %, and R&D expenses.
- Instant DCF Valuation: Automatically computes intrinsic value, NPV, and additional metrics in real-time.
- High-Precision Accuracy: Incorporates MiMedx's actual financial data for trustworthy valuation results.
- Streamlined Scenario Analysis: Easily evaluate various assumptions and analyze results side by side.
- Efficiency Booster: Avoid the hassle of creating intricate valuation models from the ground up.
How It Works
- Step 1: Download the Excel file for MiMedx Group, Inc. (MDXG).
- Step 2: Review MiMedx's pre-filled financial data and forecasts.
- Step 3: Modify key inputs such as revenue growth, WACC, and tax rates (highlighted cells).
- Step 4: Observe the DCF model update in real-time as you adjust your assumptions.
- Step 5: Analyze the outputs and leverage the results for your investment decisions.
Why Choose This Calculator for MiMedx Group, Inc. (MDXG)?
- Comprehensive Tool: Incorporates DCF, WACC, and financial ratio analyses tailored for MDXG.
- Customizable Inputs: Modify yellow-highlighted cells to explore various financial scenarios.
- Detailed Insights: Automatically calculates MiMedx’s intrinsic value and Net Present Value.
- Preloaded Data: Historical and projected data provide reliable starting points for analysis.
- Professional Quality: Perfect for financial analysts, investors, and business consultants focusing on MDXG.
Who Should Use This Product?
- Investors: Accurately estimate MiMedx Group, Inc.'s (MDXG) fair value before making investment decisions.
- CFOs: Leverage a professional-grade DCF model for financial reporting and analysis specific to MiMedx Group, Inc. (MDXG).
- Consultants: Quickly adapt the template for valuation reports tailored to clients interested in MiMedx Group, Inc. (MDXG).
- Entrepreneurs: Gain insights into financial modeling practices utilized by leading healthcare companies, including MiMedx Group, Inc. (MDXG).
- Educators: Use it as a teaching tool to demonstrate valuation methodologies relevant to MiMedx Group, Inc. (MDXG).
What the Template Contains
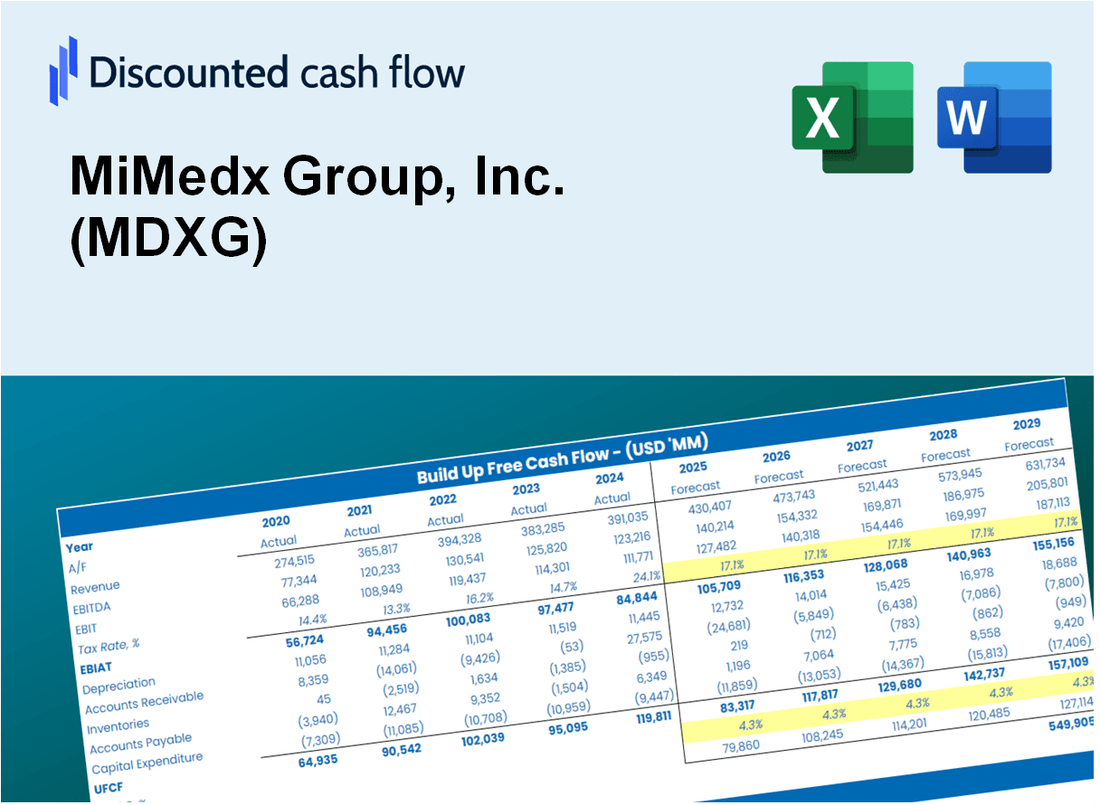
- Preloaded MDXG Data: Historical and projected financial data, including revenue, EBIT, and capital expenditures.
- DCF and WACC Models: Professional-grade sheets for calculating intrinsic value and Weighted Average Cost of Capital.
- Editable Inputs: Yellow-highlighted cells for adjusting revenue growth, tax rates, and discount rates.
- Financial Statements: Comprehensive annual and quarterly financials for deeper analysis.
- Key Ratios: Profitability, leverage, and efficiency ratios to evaluate performance.
- Dashboard and Charts: Visual summaries of valuation outcomes and assumptions.
Disclaimer
All information, articles, and product details provided on this website are for general informational and educational purposes only. We do not claim any ownership over, nor do we intend to infringe upon, any trademarks, copyrights, logos, brand names, or other intellectual property mentioned or depicted on this site. Such intellectual property remains the property of its respective owners, and any references here are made solely for identification or informational purposes, without implying any affiliation, endorsement, or partnership.
We make no representations or warranties, express or implied, regarding the accuracy, completeness, or suitability of any content or products presented. Nothing on this website should be construed as legal, tax, investment, financial, medical, or other professional advice. In addition, no part of this site—including articles or product references—constitutes a solicitation, recommendation, endorsement, advertisement, or offer to buy or sell any securities, franchises, or other financial instruments, particularly in jurisdictions where such activity would be unlawful.
All content is of a general nature and may not address the specific circumstances of any individual or entity. It is not a substitute for professional advice or services. Any actions you take based on the information provided here are strictly at your own risk. You accept full responsibility for any decisions or outcomes arising from your use of this website and agree to release us from any liability in connection with your use of, or reliance upon, the content or products found herein.