
|
ME Group International PLC (MEGP.L) DCF تقييم |
Fully Editable: Tailor To Your Needs In Excel Or Sheets
Professional Design: Trusted, Industry-Standard Templates
Investor-Approved Valuation Models
MAC/PC Compatible, Fully Unlocked
No Expertise Is Needed; Easy To Follow
ME Group International plc (MEGP.L) Bundle
استكشف النظرة المالية لمجموعة Me Group International PLC (MEGPL) مع حاسبة DCF سهلة الاستخدام! أدخل توقعاتك على النمو والهوامش والمصروفات لحساب القيمة الجوهرية لمجموعة Me Group International PLC (MEGPL) وصقل نهج الاستثمار الخاص بك.
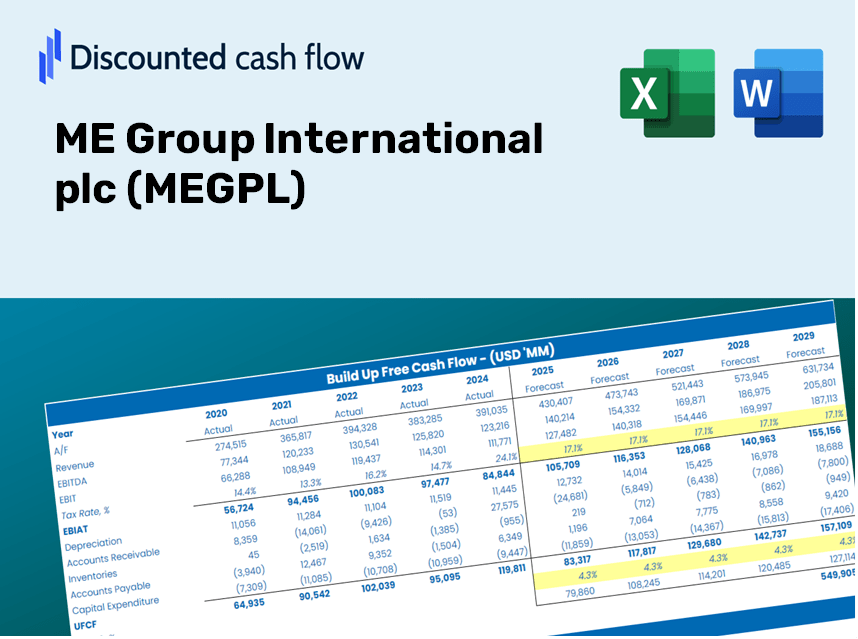
Discounted Cash Flow (DCF) - (USD MM)
| Year | AY1 2020 |
AY2 2021 |
AY3 2022 |
AY4 2023 |
AY5 2024 |
FY1 2025 |
FY2 2026 |
FY3 2027 |
FY4 2028 |
FY5 2029 |
|---|---|---|---|---|---|---|---|---|---|---|
| Revenue | 186.4 | 214.4 | 259.8 | 297.7 | 307.9 | 349.6 | 397.0 | 450.8 | 511.9 | 581.3 |
| Revenue Growth, % | 0 | 15.03 | 21.16 | 14.58 | 3.43 | 13.55 | 13.55 | 13.55 | 13.55 | 13.55 |
| EBITDA | 28.1 | 63.2 | 94.3 | 107.9 | 115.9 | 108.2 | 122.9 | 139.5 | 158.4 | 179.9 |
| EBITDA, % | 15.08 | 29.47 | 36.32 | 36.26 | 37.63 | 30.95 | 30.95 | 30.95 | 30.95 | 30.95 |
| Depreciation | 54.0 | 31.7 | 38.8 | 38.3 | 39.8 | 59.1 | 67.1 | 76.2 | 86.5 | 98.3 |
| Depreciation, % | 28.98 | 14.77 | 14.95 | 12.88 | 12.94 | 16.91 | 16.91 | 16.91 | 16.91 | 16.91 |
| EBIT | -25.9 | 31.5 | 55.5 | 69.6 | 76.0 | 49.1 | 55.8 | 63.3 | 71.9 | 81.6 |
| EBIT, % | -13.91 | 14.69 | 21.37 | 23.38 | 24.7 | 14.05 | 14.05 | 14.05 | 14.05 | 14.05 |
| Total Cash | 107.2 | 99.4 | 136.2 | 111.1 | 86.1 | 154.9 | 175.9 | 199.8 | 226.8 | 257.6 |
| Total Cash, percent | .0 | .0 | .0 | .0 | .0 | .0 | .0 | .0 | .0 | .0 |
| Account Receivables | 17.0 | 9.7 | 5.9 | 5.2 | 15.4 | 15.8 | 18.0 | 20.4 | 23.2 | 26.3 |
| Account Receivables, % | 9.1 | 4.53 | 2.26 | 1.74 | 5.01 | 4.53 | 4.53 | 4.53 | 4.53 | 4.53 |
| Inventories | 16.6 | 18.5 | 25.5 | 32.5 | 38.1 | 35.4 | 40.2 | 45.6 | 51.8 | 58.8 |
| Inventories, % | 8.91 | 8.61 | 9.81 | 10.92 | 12.36 | 10.12 | 10.12 | 10.12 | 10.12 | 10.12 |
| Accounts Payable | 21.8 | 24.6 | 29.4 | 33.4 | 31.2 | 39.0 | 44.3 | 50.3 | 57.1 | 64.9 |
| Accounts Payable, % | 11.7 | 11.47 | 11.3 | 11.22 | 10.13 | 11.16 | 11.16 | 11.16 | 11.16 | 11.16 |
| Capital Expenditure | -47.1 | -26.4 | -32.7 | -49.6 | -54.6 | -59.1 | -67.1 | -76.2 | -86.6 | -98.3 |
| Capital Expenditure, % | -25.27 | -12.3 | -12.58 | -16.68 | -17.74 | -16.91 | -16.91 | -16.91 | -16.91 | -16.91 |
| Tax Rate, % | 26.33 | 26.33 | 26.33 | 26.33 | 26.33 | 26.33 | 26.33 | 26.33 | 26.33 | 26.33 |
| EBITAT | -23.1 | 24.0 | 40.4 | 52.6 | 56.0 | 38.0 | 43.2 | 49.0 | 55.7 | 63.2 |
| Depreciation | ||||||||||
| Changes in Account Receivables | ||||||||||
| Changes in Inventories | ||||||||||
| Changes in Accounts Payable | ||||||||||
| Capital Expenditure | ||||||||||
| UFCF | -28.0 | 37.4 | 48.1 | 39.0 | 23.2 | 48.1 | 41.5 | 47.1 | 53.5 | 60.8 |
| WACC, % | 6.28 | 6.23 | 6.22 | 6.23 | 6.22 | 6.24 | 6.24 | 6.24 | 6.24 | 6.24 |
| PV UFCF | ||||||||||
| SUM PV UFCF | 208.3 | |||||||||
| Long Term Growth Rate, % | 2.00 | |||||||||
| Free cash flow (T + 1) | 62 | |||||||||
| Terminal Value | 1,463 | |||||||||
| Present Terminal Value | 1,081 | |||||||||
| Enterprise Value | 1,289 | |||||||||
| Net Debt | -26 | |||||||||
| Equity Value | 1,316 | |||||||||
| Diluted Shares Outstanding, MM | 379 | |||||||||
| Equity Value Per Share | 347.01 |
ماذا ستتلقى
- نموذج مالي شامل: تسهل بيانات ME Group International Plc الفعلية تقييم DCF دقيق.
- التحكم الكامل في التنبؤ: تعديل نمو الإيرادات ، هوامش الربح ، WACC ، والمقاييس الأساسية الأخرى.
- الحسابات في الوقت الحقيقي: توفر التحديثات التلقائية ملاحظات فورية عند إجراء تعديلات.
- قالب من الدرجة المهنية: ملف Excel المصقول المصنوع من أجل تقييم عالي الجودة.
- مرنة وقابلة لإعادة الاستخدام: مصممة للتكيف ، مما يتيح الاستخدام المستمر للتنبؤات الشاملة.
الميزات الرئيسية
- البيانات المحملة مسبقًا: البيانات المالية التاريخية لمجموعة ME Group International plc والتوقعات المملوءة مسبقًا.
- المدخلات القابلة للتعديل بالكامل: خياط WACC، معدلات الضرائب، نمو الإيرادات، وهوامش EBITDA لتفضيلاتك.
- النتائج الفورية: شاهد تحديثات القيمة الجوهرية لـ ME Group International plc في الوقت الفعلي.
- المخرجات المرئية الواضحة: توضح مخططات لوحة القيادة نتائج التقييم والمقاييس الأساسية.
- بنيت للدقة: أداة موثوقة مصممة للمحللين والمستثمرين والمهنيين الماليين.
كيف تعمل
- الخطوة 1: قم بتنزيل جدول بيانات Excel.
- الخطوة 2: افحص بيانات ME PRC International PLC (MEGPL) المليئة مسبقًا (التاريخية والمتوقعة).
- الخطوة 3: تعديل الافتراضات الرئيسية (المبرمة باللون الأصفر) وفقا لتحليلك.
- الخطوة 4: راقب التحديثات التلقائية لـ Me Group International Plc القيمة الجوهرية.
- الخطوة 5: الاستفادة من نتائج استراتيجيات الاستثمار الخاصة بك أو احتياجات الإبلاغ.
لماذا اختر حاسبة ME Group International plc (MEGPL) ؟
- توفير الوقت: تخطي متاعب بناء نموذج DCF من الألف إلى الياء - أداتنا جاهزة للاستخدام الفوري.
- دقة معززة: استخدام بيانات وصيغ مالية يمكن الاعتماد عليها للتقليل إلى أدنى حد من أخطاء التقييم.
- قابل للتخصيص بالكامل: اضبط النموذج ليتوافق مع افتراضاتك وتوقعاتك المحددة.
- سهل الاستخدام: وتؤدي المخططات والمخرجات البديهية إلى تبسيط عملية تحليل النتائج.
- أقرها الفنيون: صُنع لخبراء الصناعة الذين يعطون الأولوية للدقة وسهولة الاستخدام.
من يجب أن يستخدم هذا المنتج؟
- المستثمرون الأفراد: اكتساب رؤى لاتخاذ قرارات متعلمة حول أسهم Trading Me Group International PLC (MEGPL).
- المحللون الماليون: تعزيز منهجيات التقييم مع نماذج مالية مصممة مسبقًا مصممة ل Megpl.
- الاستشاريون: تزويد العملاء بتحليل تقييم دقيق لـ Me Group International PLC (MEGPL) بسرعة وفعالية.
- أصحاب الأعمال: تعرف على حجم الشركات الكبيرة مثل Megpl لإبلاغ استراتيجيات عملك الخاصة.
- طلاب التمويل: تطوير مهارات التقييم باستخدام بيانات الحياة الواقعية ودراسات الحالة المتعلقة بـ ME Group International PLC (MEGPL).
محتويات القالب
- البيانات المليئة مسبقا: ميزات Me Group International PLC الأداء المالي والتوقعات التاريخي.
- نموذج التدفق النقدي المخفض: نموذج تقييم DCF قابل للتحرير مع حسابات تلقائية للراحة.
- متوسط تكلفة رأس المال المرجح (WACC): ورقة محددة مصممة لحساب WACC باستخدام المدخلات المخصصة الخاصة بك.
- النسب المالية الرئيسية: تقييم Me Group International Plc الربحية ، والكفاءة التشغيلية ، والاستفادة من المقاييس.
- مدخلات قابلة للتخصيص: تعديل معدلات نمو الإيرادات دون عناء ، وهامش الربح ، ونسب الضرائب.
- لوحة القيادة الصافية: التمثيلات المرئية والجداول التي تلخص نتائج التقييم الأساسية.
Disclaimer
All information, articles, and product details provided on this website are for general informational and educational purposes only. We do not claim any ownership over, nor do we intend to infringe upon, any trademarks, copyrights, logos, brand names, or other intellectual property mentioned or depicted on this site. Such intellectual property remains the property of its respective owners, and any references here are made solely for identification or informational purposes, without implying any affiliation, endorsement, or partnership.
We make no representations or warranties, express or implied, regarding the accuracy, completeness, or suitability of any content or products presented. Nothing on this website should be construed as legal, tax, investment, financial, medical, or other professional advice. In addition, no part of this site—including articles or product references—constitutes a solicitation, recommendation, endorsement, advertisement, or offer to buy or sell any securities, franchises, or other financial instruments, particularly in jurisdictions where such activity would be unlawful.
All content is of a general nature and may not address the specific circumstances of any individual or entity. It is not a substitute for professional advice or services. Any actions you take based on the information provided here are strictly at your own risk. You accept full responsibility for any decisions or outcomes arising from your use of this website and agree to release us from any liability in connection with your use of, or reliance upon, the content or products found herein.