
|
شركة مانولايف المالية (MFC) تقييم DCF |
Fully Editable: Tailor To Your Needs In Excel Or Sheets
Professional Design: Trusted, Industry-Standard Templates
Investor-Approved Valuation Models
MAC/PC Compatible, Fully Unlocked
No Expertise Is Needed; Easy To Follow
Manulife Financial Corporation (MFC) Bundle
كمستثمر أو محلل ، تعد حاسبة Manulife Financial Corporation (MFC) DCF موردك للتقييم الدقيق. محملة ببيانات حقيقية من Manulife Financial Corporation ، يمكنك ضبط التوقعات ومراقبة الآثار على الفور.
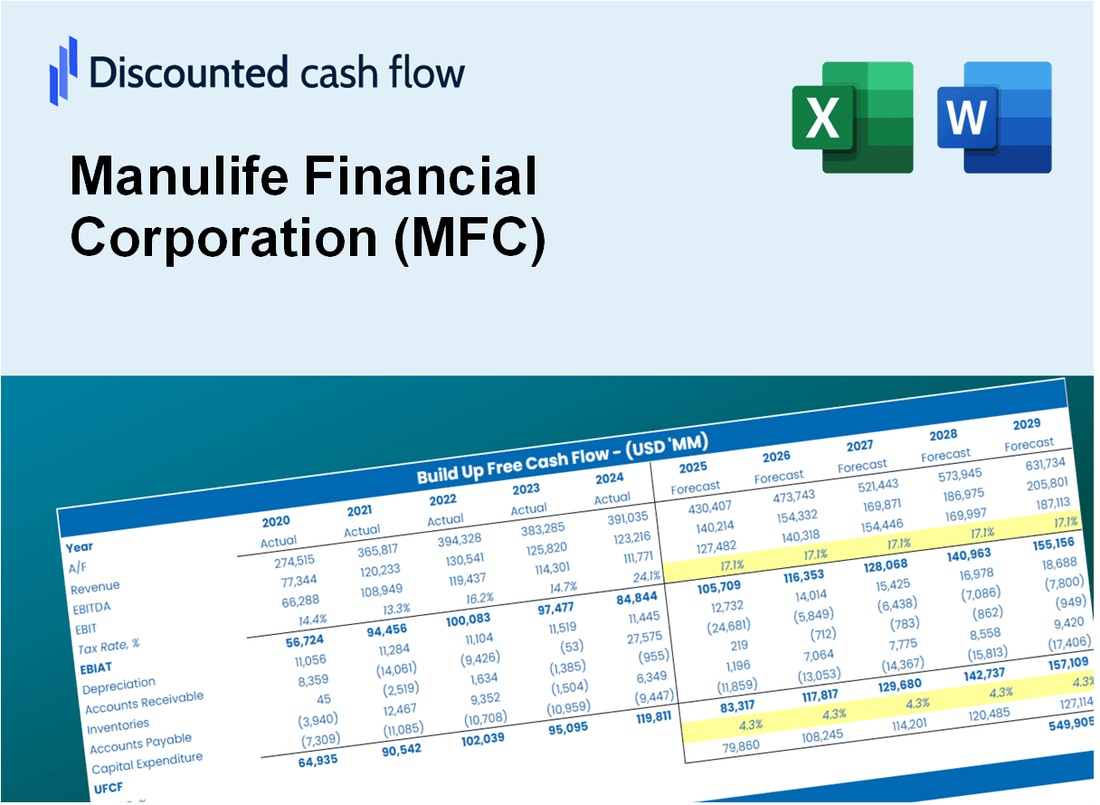
Discounted Cash Flow (DCF) - (USD MM)
| Year | AY1 2020 |
AY2 2021 |
AY3 2022 |
AY4 2023 |
AY5 2024 |
FY1 2025 |
FY2 2026 |
FY3 2027 |
FY4 2028 |
FY5 2029 |
|---|---|---|---|---|---|---|---|---|---|---|
| Revenue | 55,011.8 | 42,685.6 | 16,846.4 | -5,019.6 | 32,514.4 | 9,515.3 | 2,784.7 | 814.9 | 238.5 | 69.8 |
| Revenue Growth, % | 0 | -22.41 | -60.53 | -129.8 | -747.75 | -70.74 | -70.74 | -70.74 | -70.74 | -70.74 |
| EBITDA | 6,140.2 | 6,894.2 | -1,118.5 | 4,700.0 | 5,181.5 | -1,085.2 | -317.6 | -92.9 | -27.2 | -8.0 |
| EBITDA, % | 11.16 | 16.15 | -6.64 | -93.63 | 15.94 | -11.4 | -11.4 | -11.4 | -11.4 | -11.4 |
| Depreciation | 467.9 | 377.3 | 370.2 | -1,010.8 | -1,075.0 | 395.1 | 115.6 | 33.8 | 9.9 | 2.9 |
| Depreciation, % | 0.85061 | 0.88401 | 2.2 | 20.14 | -3.31 | 4.15 | 4.15 | 4.15 | 4.15 | 4.15 |
| EBIT | 5,672.3 | 6,516.9 | -1,488.7 | 5,710.8 | 6,256.5 | -1,218.3 | -356.5 | -104.3 | -30.5 | -8.9 |
| EBIT, % | 10.31 | 15.27 | -8.84 | -113.77 | 19.24 | -12.8 | -12.8 | -12.8 | -12.8 | -12.8 |
| Total Cash | 18,665.4 | 16,116.7 | 13,662.2 | 14,507.5 | 18,395.7 | 2,081.2 | 609.1 | 178.2 | 52.2 | 15.3 |
| Total Cash, percent | .0 | .0 | .0 | .0 | .0 | .0 | .0 | .0 | .0 | .0 |
| Account Receivables | 1,030.0 | 923.0 | 1,032.9 | .0 | .0 | 193.5 | 56.6 | 16.6 | 4.8 | 1.4 |
| Account Receivables, % | 1.87 | 2.16 | 6.13 | 0 | 0 | 2.03 | 2.03 | 2.03 | 2.03 | 2.03 |
| Inventories | .0 | .0 | .0 | .0 | .0 | .0 | .0 | .0 | .0 | .0 |
| Inventories, % | 0 | 0 | 0 | 0 | 0 | 0 | 0 | 0 | 0 | 0 |
| Accounts Payable | 8,193.9 | 8,655.4 | 9,731.1 | .0 | .0 | 1,768.6 | 517.6 | 151.5 | 44.3 | 13.0 |
| Accounts Payable, % | 14.89 | 20.28 | 57.76 | 0 | 0 | 18.59 | 18.59 | 18.59 | 18.59 | 18.59 |
| Capital Expenditure | .0 | 17,298.0 | 12,983.8 | .0 | .0 | .0 | .0 | .0 | .0 | .0 |
| Capital Expenditure, % | 0 | 40.52 | 77.07 | 0 | 0 | 0 | 0 | 0 | 0 | 0 |
| Tax Rate, % | 20.58 | 20.58 | 20.58 | 20.58 | 20.58 | 20.58 | 20.58 | 20.58 | 20.58 | 20.58 |
| EBITAT | 4,461.8 | 5,339.4 | -996.3 | 4,835.4 | 4,969.0 | -954.2 | -279.2 | -81.7 | -23.9 | -7.0 |
| Depreciation | ||||||||||
| Changes in Account Receivables | ||||||||||
| Changes in Inventories | ||||||||||
| Changes in Accounts Payable | ||||||||||
| Capital Expenditure | ||||||||||
| UFCF | 12,093.6 | 23,583.2 | 13,323.6 | -4,873.5 | 3,894.1 | 1,016.1 | -1,277.8 | -373.9 | -109.4 | -32.0 |
| WACC, % | 8.07 | 8.12 | 7.87 | 8.17 | 8.08 | 8.06 | 8.06 | 8.06 | 8.06 | 8.06 |
| PV UFCF | ||||||||||
| SUM PV UFCF | -552.3 | |||||||||
| Long Term Growth Rate, % | 2.00 | |||||||||
| Free cash flow (T + 1) | -33 | |||||||||
| Terminal Value | -539 | |||||||||
| Present Terminal Value | -366 | |||||||||
| Enterprise Value | -918 | |||||||||
| Net Debt | -8,294 | |||||||||
| Equity Value | 7,376 | |||||||||
| Diluted Shares Outstanding, MM | 1,785 | |||||||||
| Equity Value Per Share | 4.13 |
What You Will Get
- Pre-Filled Financial Model: Manulife Financial Corporation’s (MFC) actual data enables precise DCF valuation.
- Full Forecast Control: Adjust revenue growth, margins, WACC, and other key drivers specific to (MFC).
- Instant Calculations: Automatic updates ensure you see results as you make changes to (MFC) data.
- Investor-Ready Template: A refined Excel file designed for professional-grade valuation of (MFC).
- Customizable and Reusable: Tailored for flexibility, allowing repeated use for detailed forecasts on (MFC).
Key Features
- Real-Life MFC Data: Pre-filled with Manulife Financial’s historical financials and forward-looking projections.
- Fully Customizable Inputs: Adjust revenue growth, margins, WACC, tax rates, and capital expenditures to suit your analysis.
- Dynamic Valuation Model: Automatic updates to Net Present Value (NPV) and intrinsic value based on your customized inputs.
- Scenario Testing: Create multiple forecast scenarios to explore various valuation outcomes.
- User-Friendly Design: Intuitive, structured, and designed for both professionals and beginners.
How It Works
- Step 1: Download the Excel file.
- Step 2: Review Manulife Financial Corporation’s pre-filled financial data and forecasts.
- Step 3: Modify critical inputs like revenue growth, WACC, and tax rates (highlighted cells).
- Step 4: Watch the DCF model update instantly as you tweak assumptions.
- Step 5: Analyze the outputs and use the results for investment decisions regarding Manulife Financial Corporation (MFC).
Why Choose This Calculator for Manulife Financial Corporation (MFC)?
- All-in-One Solution: Offers DCF, WACC, and financial ratio analyses tailored for MFC.
- Flexible Inputs: Modify the yellow-highlighted cells to explore different financial scenarios.
- In-Depth Analysis: Automatically computes Manulife’s intrinsic value and Net Present Value.
- Data Ready: Comes with historical and projected data for precise calculations.
- High Standards: Perfect for financial analysts, investors, and business advisors focused on MFC.
Who Should Use This Product?
- Investors: Accurately estimate Manulife Financial Corporation’s (MFC) fair value before making investment decisions.
- CFOs: Leverage a professional-grade DCF model for financial reporting and analysis specific to Manulife Financial Corporation (MFC).
- Consultants: Quickly adapt the template for valuation reports tailored for Manulife Financial Corporation (MFC) clients.
- Entrepreneurs: Gain insights into financial modeling practices used by leading financial institutions like Manulife Financial Corporation (MFC).
- Educators: Use it as a teaching tool to demonstrate valuation methodologies applicable to Manulife Financial Corporation (MFC).
What the Template Contains
- Preloaded MFC Data: Historical and projected financial data, including revenue, EBIT, and capital expenditures.
- DCF and WACC Models: Professional-grade sheets for calculating intrinsic value and Weighted Average Cost of Capital.
- Editable Inputs: Yellow-highlighted cells for adjusting revenue growth, tax rates, and discount rates.
- Financial Statements: Comprehensive annual and quarterly financials for deeper analysis.
- Key Ratios: Profitability, leverage, and efficiency ratios to evaluate performance.
- Dashboard and Charts: Visual summaries of valuation outcomes and assumptions.
Disclaimer
All information, articles, and product details provided on this website are for general informational and educational purposes only. We do not claim any ownership over, nor do we intend to infringe upon, any trademarks, copyrights, logos, brand names, or other intellectual property mentioned or depicted on this site. Such intellectual property remains the property of its respective owners, and any references here are made solely for identification or informational purposes, without implying any affiliation, endorsement, or partnership.
We make no representations or warranties, express or implied, regarding the accuracy, completeness, or suitability of any content or products presented. Nothing on this website should be construed as legal, tax, investment, financial, medical, or other professional advice. In addition, no part of this site—including articles or product references—constitutes a solicitation, recommendation, endorsement, advertisement, or offer to buy or sell any securities, franchises, or other financial instruments, particularly in jurisdictions where such activity would be unlawful.
All content is of a general nature and may not address the specific circumstances of any individual or entity. It is not a substitute for professional advice or services. Any actions you take based on the information provided here are strictly at your own risk. You accept full responsibility for any decisions or outcomes arising from your use of this website and agree to release us from any liability in connection with your use of, or reliance upon, the content or products found herein.