
|
Magnite ، Inc. (MGNI) تقييم DCF |
Fully Editable: Tailor To Your Needs In Excel Or Sheets
Professional Design: Trusted, Industry-Standard Templates
Investor-Approved Valuation Models
MAC/PC Compatible, Fully Unlocked
No Expertise Is Needed; Easy To Follow
Magnite, Inc. (MGNI) Bundle
عزز استراتيجياتك الاستثمارية مع Magnite، Inc. (MGNI) حاسبة DCF! انغمس في البيانات المالية الحقيقية، واضبط توقعات النمو والنفقات، ولاحظ كيف تؤثر التعديلات على القيمة الجوهرية لشركة Magnite، Inc. (MGNI) في الوقت الفعلي.
What You Will Get
- Editable Excel Template: A fully customizable Excel-based DCF Calculator featuring pre-filled real MGNI financials.
- Real-World Data: Historical data and forward-looking estimates (as indicated in the yellow cells).
- Forecast Flexibility: Modify forecast assumptions such as revenue growth, EBITDA %, and WACC.
- Automatic Calculations: Instantly observe the effect of your inputs on Magnite’s valuation.
- Professional Tool: Designed for investors, CFOs, consultants, and financial analysts.
- User-Friendly Design: Organized for clarity and ease of use, complete with step-by-step instructions.
Key Features
- 🔍 Real-Life MGNI Financials: Pre-filled historical and projected data for Magnite, Inc. (MGNI).
- ✏️ Fully Customizable Inputs: Adjust all critical parameters (yellow cells) like WACC, growth %, and tax rates.
- 📊 Professional DCF Valuation: Built-in formulas calculate Magnite’s intrinsic value using the Discounted Cash Flow method.
- ⚡ Instant Results: Visualize Magnite’s valuation instantly after making changes.
- Scenario Analysis: Test and compare outcomes for various financial assumptions side-by-side.
How It Works
- Download: Obtain the comprehensive Excel file featuring Magnite, Inc.'s (MGNI) financial metrics.
- Customize: Tailor your projections, including revenue growth rates, EBITDA percentages, and WACC.
- Update Automatically: Watch as the intrinsic value and NPV calculations refresh in real-time.
- Test Scenarios: Generate various forecasts and instantly compare the results.
- Make Decisions: Leverage the valuation insights to inform your investment approach.
Why Choose This Calculator for Magnite, Inc. (MGNI)?
- Accurate Data: Up-to-date Magnite financials provide dependable valuation outcomes.
- Customizable: Tailor essential parameters such as growth rates, WACC, and tax rates to fit your forecasts.
- Time-Saving: Ready-to-use calculations save you from starting from the ground up.
- Professional-Grade Tool: Crafted for investors, analysts, and consultants in the advertising technology sector.
- User-Friendly: Simple interface and guided instructions make it accessible for all users.
Who Should Use This Product?
- Digital Advertising Students: Understand programmatic advertising strategies and apply them using industry data.
- Researchers: Integrate advanced advertising models into academic studies or projects.
- Marketers: Validate your marketing strategies and evaluate performance metrics for Magnite, Inc. (MGNI).
- Data Analysts: Enhance your analysis with a customizable advertising performance model.
- Entrepreneurs: Discover how major players like Magnite, Inc. (MGNI) navigate the advertising landscape.
What the Template Contains
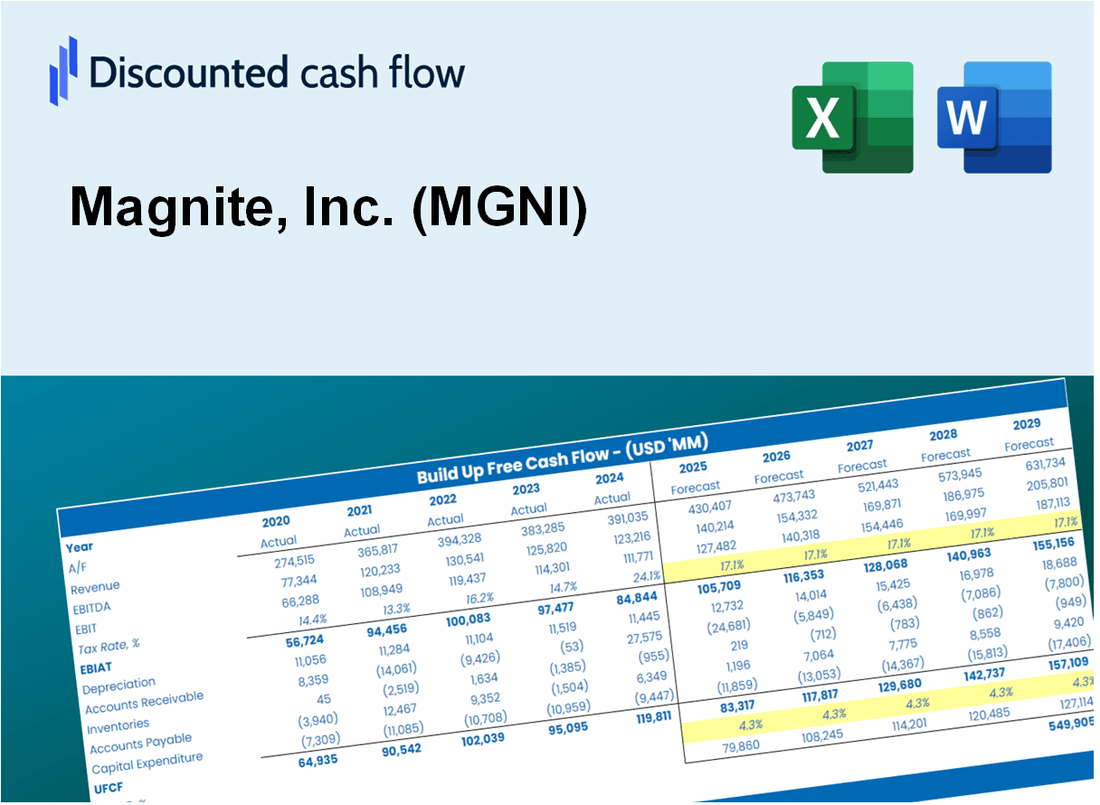
- Operating and Balance Sheet Data: Pre-filled Magnite historical data and forecasts, including revenue, EBITDA, EBIT, and capital expenditures.
- WACC Calculation: A dedicated sheet for Weighted Average Cost of Capital (WACC), including parameters like Beta, risk-free rate, and share price.
- DCF Valuation (Unlevered and Levered): Editable Discounted Cash Flow models showing intrinsic value with detailed calculations.
- Financial Statements: Pre-loaded financial statements (annual and quarterly) to support analysis.
- Key Ratios: Includes profitability, leverage, and efficiency ratios for Magnite, Inc. (MGNI).
- Dashboard and Charts: Visual summary of valuation outputs and assumptions to analyze results easily.
Disclaimer
All information, articles, and product details provided on this website are for general informational and educational purposes only. We do not claim any ownership over, nor do we intend to infringe upon, any trademarks, copyrights, logos, brand names, or other intellectual property mentioned or depicted on this site. Such intellectual property remains the property of its respective owners, and any references here are made solely for identification or informational purposes, without implying any affiliation, endorsement, or partnership.
We make no representations or warranties, express or implied, regarding the accuracy, completeness, or suitability of any content or products presented. Nothing on this website should be construed as legal, tax, investment, financial, medical, or other professional advice. In addition, no part of this site—including articles or product references—constitutes a solicitation, recommendation, endorsement, advertisement, or offer to buy or sell any securities, franchises, or other financial instruments, particularly in jurisdictions where such activity would be unlawful.
All content is of a general nature and may not address the specific circumstances of any individual or entity. It is not a substitute for professional advice or services. Any actions you take based on the information provided here are strictly at your own risk. You accept full responsibility for any decisions or outcomes arising from your use of this website and agree to release us from any liability in connection with your use of, or reliance upon, the content or products found herein.