
|
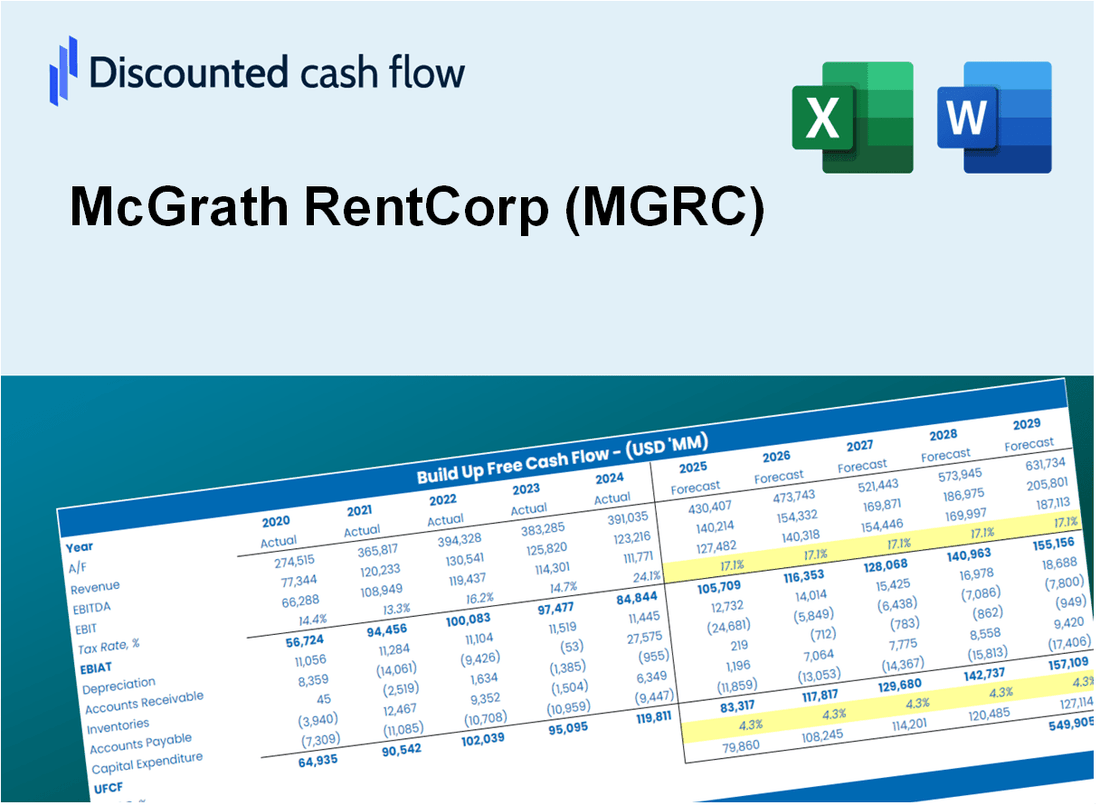
McGrath Rentcorp (MGRC) تقييم DCF |
Fully Editable: Tailor To Your Needs In Excel Or Sheets
Professional Design: Trusted, Industry-Standard Templates
Investor-Approved Valuation Models
MAC/PC Compatible, Fully Unlocked
No Expertise Is Needed; Easy To Follow
McGrath RentCorp (MGRC) Bundle
تبحث لتقييم القيمة الجوهرية لـ McGrath Rentcorp؟ يدمج حاسبة DCF (MGRC) DCF بيانات العالم الحقيقي مع ميزات تخصيص واسعة ، مما يتيح لك ضبط التوقعات وتعزيز خيارات الاستثمار الخاصة بك.
What You Will Get
- Editable Excel Template: A fully customizable Excel-based DCF Calculator featuring pre-filled real MGRC financials.
- Real-World Data: Historical performance data and forward-looking estimates (highlighted in the yellow cells).
- Forecast Flexibility: Adjust forecast assumptions such as revenue growth, EBITDA %, and WACC.
- Automatic Calculations: Instantly visualize the effect of your inputs on McGrath RentCorp’s valuation.
- Professional Tool: Designed for investors, CFOs, consultants, and financial analysts.
- User-Friendly Design: Organized for clarity and ease of use, complete with step-by-step instructions.
Key Features
- Comprehensive Financial Data: McGrath RentCorp’s historical financial statements and pre-filled projections.
- Customizable Parameters: Adjust WACC, tax rates, revenue growth, and EBITDA margins as needed.
- Real-Time Insights: Monitor McGrath RentCorp’s intrinsic value recalculating instantly.
- Intuitive Visual Representations: Dashboard graphs illustrate valuation outcomes and essential metrics.
- Designed for Precision: A reliable tool for analysts, investors, and finance professionals.
How It Works
- Step 1: Download the Excel file.
- Step 2: Review McGrath RentCorp’s pre-filled financial data and forecasts.
- Step 3: Modify critical inputs like revenue growth, WACC, and tax rates (highlighted cells).
- Step 4: Watch the DCF model update instantly as you tweak assumptions.
- Step 5: Analyze the outputs and use the results for investment decisions.
Why Choose McGrath RentCorp (MGRC)?
- Streamlined Process: Quickly access rental solutions without lengthy setups.
- Enhanced Reliability: Dependable equipment and services minimize downtime and maximize efficiency.
- Customizable Options: Flexible rental plans to suit your specific project needs.
- User-Friendly Experience: Intuitive interface and support make it easy to find what you need.
- Industry Leader: Trusted by businesses for quality and exceptional customer service.
Who Should Use This Product?
- Professional Investors: Create comprehensive and dependable valuation models for analyzing McGrath RentCorp (MGRC).
- Corporate Finance Teams: Evaluate valuation scenarios to inform strategic decisions within the company.
- Consultants and Advisors: Deliver precise valuation insights to clients regarding McGrath RentCorp (MGRC).
- Students and Educators: Utilize real-world data to enhance learning and practice in financial modeling.
- Industry Analysts: Gain a deeper understanding of how rental service companies like McGrath RentCorp (MGRC) are valued in the market.
What the Template Contains
- Comprehensive DCF Model: Editable template featuring thorough valuation calculations.
- Real-World Data: McGrath RentCorp’s historical and projected financials preloaded for in-depth analysis.
- Customizable Parameters: Modify WACC, growth rates, and tax assumptions to explore various scenarios.
- Financial Statements: Complete annual and quarterly breakdowns for enhanced insights.
- Key Ratios: Integrated analysis for profitability, efficiency, and leverage metrics.
- Dashboard with Visual Outputs: Charts and tables to present clear, actionable results.
Disclaimer
All information, articles, and product details provided on this website are for general informational and educational purposes only. We do not claim any ownership over, nor do we intend to infringe upon, any trademarks, copyrights, logos, brand names, or other intellectual property mentioned or depicted on this site. Such intellectual property remains the property of its respective owners, and any references here are made solely for identification or informational purposes, without implying any affiliation, endorsement, or partnership.
We make no representations or warranties, express or implied, regarding the accuracy, completeness, or suitability of any content or products presented. Nothing on this website should be construed as legal, tax, investment, financial, medical, or other professional advice. In addition, no part of this site—including articles or product references—constitutes a solicitation, recommendation, endorsement, advertisement, or offer to buy or sell any securities, franchises, or other financial instruments, particularly in jurisdictions where such activity would be unlawful.
All content is of a general nature and may not address the specific circumstances of any individual or entity. It is not a substitute for professional advice or services. Any actions you take based on the information provided here are strictly at your own risk. You accept full responsibility for any decisions or outcomes arising from your use of this website and agree to release us from any liability in connection with your use of, or reliance upon, the content or products found herein.