
|
3M Company (MMM) تقييم DCF |
Fully Editable: Tailor To Your Needs In Excel Or Sheets
Professional Design: Trusted, Industry-Standard Templates
Investor-Approved Valuation Models
MAC/PC Compatible, Fully Unlocked
No Expertise Is Needed; Easy To Follow
3M Company (MMM) Bundle
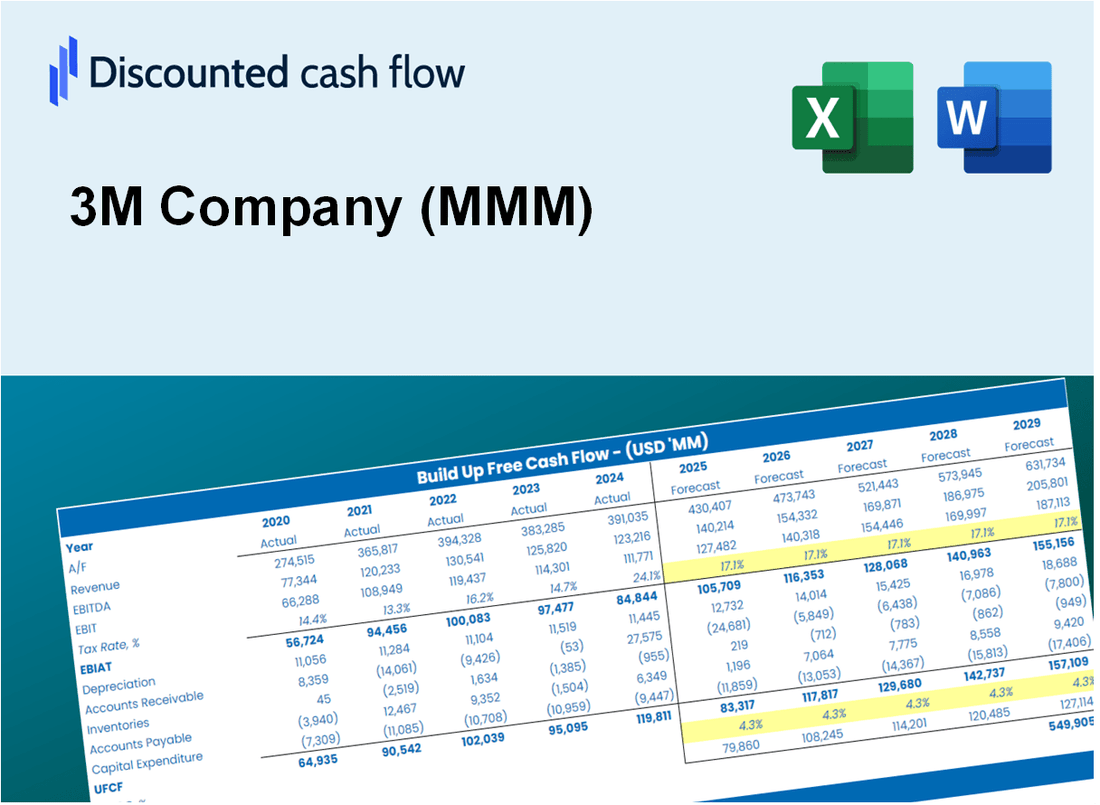
تم تصميم حاسبة DCF 3M (MMM) من أجل الدقة ، وتمكين تقييم شركة 3M للشركة باستخدام البيانات المالية في العالم الحقيقي ، مما يوفر مرونة كاملة لتعديل جميع المعلمات الرئيسية للتوقعات المحسنة.
Discounted Cash Flow (DCF) - (USD MM)
| Year | AY1 2020 |
AY2 2021 |
AY3 2022 |
AY4 2023 |
AY5 2024 |
FY1 2025 |
FY2 2026 |
FY3 2027 |
FY4 2028 |
FY5 2029 |
|---|---|---|---|---|---|---|---|---|---|---|
| Revenue | 32,184.0 | 35,355.0 | 34,229.0 | 24,610.0 | 24,575.0 | 23,249.4 | 21,995.3 | 20,808.9 | 19,686.4 | 18,624.5 |
| Revenue Growth, % | 0 | 9.85 | -3.18 | -28.1 | -0.14222 | -5.39 | -5.39 | -5.39 | -5.39 | -5.39 |
| EBITDA | 9,259.0 | 9,576.0 | 8,721.0 | -8,906.0 | 7,225.0 | 3,466.2 | 3,279.2 | 3,102.3 | 2,935.0 | 2,776.7 |
| EBITDA, % | 28.77 | 27.09 | 25.48 | -36.19 | 29.4 | 14.91 | 14.91 | 14.91 | 14.91 | 14.91 |
| Depreciation | 1,911.0 | 1,915.0 | 1,831.0 | 1,433.0 | 1,224.0 | 1,279.0 | 1,210.1 | 1,144.8 | 1,083.0 | 1,024.6 |
| Depreciation, % | 5.94 | 5.42 | 5.35 | 5.82 | 4.98 | 5.5 | 5.5 | 5.5 | 5.5 | 5.5 |
| EBIT | 7,348.0 | 7,661.0 | 6,890.0 | -10,339.0 | 6,001.0 | 2,187.2 | 2,069.2 | 1,957.6 | 1,852.0 | 1,752.1 |
| EBIT, % | 22.83 | 21.67 | 20.13 | -42.01 | 24.42 | 9.41 | 9.41 | 9.41 | 9.41 | 9.41 |
| Total Cash | 5,038.0 | 4,765.0 | 3,893.0 | 5,785.0 | 7,728.0 | 4,438.7 | 4,199.3 | 3,972.7 | 3,758.5 | 3,555.7 |
| Total Cash, percent | .0 | .0 | .0 | .0 | .0 | .0 | .0 | .0 | .0 | .0 |
| Account Receivables | 4,830.0 | 4,770.0 | 4,635.0 | 3,710.0 | 3,272.0 | 3,274.9 | 3,098.3 | 2,931.1 | 2,773.0 | 2,623.4 |
| Account Receivables, % | 15.01 | 13.49 | 13.54 | 15.08 | 13.31 | 14.09 | 14.09 | 14.09 | 14.09 | 14.09 |
| Inventories | 4,239.0 | 4,985.0 | 5,372.0 | 3,944.0 | 3,698.0 | 3,442.7 | 3,257.0 | 3,081.3 | 2,915.1 | 2,757.9 |
| Inventories, % | 13.17 | 14.1 | 15.69 | 16.03 | 15.05 | 14.81 | 14.81 | 14.81 | 14.81 | 14.81 |
| Accounts Payable | 2,561.0 | 2,994.0 | 3,183.0 | 2,776.0 | 2,660.0 | 2,224.0 | 2,104.0 | 1,990.5 | 1,883.2 | 1,781.6 |
| Accounts Payable, % | 7.96 | 8.47 | 9.3 | 11.28 | 10.82 | 9.57 | 9.57 | 9.57 | 9.57 | 9.57 |
| Capital Expenditure | -1,501.0 | -1,603.0 | -1,749.0 | -1,615.0 | -1,181.0 | -1,193.9 | -1,129.5 | -1,068.6 | -1,010.9 | -956.4 |
| Capital Expenditure, % | -4.66 | -4.53 | -5.11 | -6.56 | -4.81 | -5.14 | -5.14 | -5.14 | -5.14 | -5.14 |
| Tax Rate, % | 13.57 | 13.57 | 13.57 | 13.57 | 13.57 | 13.57 | 13.57 | 13.57 | 13.57 | 13.57 |
| EBITAT | 5,896.8 | 6,287.9 | 6,216.4 | -6,426.8 | 5,186.9 | 1,754.7 | 1,660.1 | 1,570.5 | 1,485.8 | 1,405.7 |
| Depreciation | ||||||||||
| Changes in Account Receivables | ||||||||||
| Changes in Inventories | ||||||||||
| Changes in Accounts Payable | ||||||||||
| Capital Expenditure | ||||||||||
| UFCF | -201.2 | 6,346.9 | 6,235.4 | -4,662.8 | 5,797.9 | 1,656.2 | 1,983.0 | 1,876.1 | 1,774.9 | 1,679.1 |
| WACC, % | 8.89 | 8.91 | 9 | 8.69 | 8.96 | 8.89 | 8.89 | 8.89 | 8.89 | 8.89 |
| PV UFCF | ||||||||||
| SUM PV UFCF | 7,005.8 | |||||||||
| Long Term Growth Rate, % | 2.00 | |||||||||
| Free cash flow (T + 1) | 1,713 | |||||||||
| Terminal Value | 24,858 | |||||||||
| Present Terminal Value | 16,237 | |||||||||
| Enterprise Value | 23,243 | |||||||||
| Net Debt | 8,059 | |||||||||
| Equity Value | 15,184 | |||||||||
| Diluted Shares Outstanding, MM | 552 | |||||||||
| Equity Value Per Share | 27.49 |
What You Will Get
- Editable Excel Template: A fully customizable Excel-based DCF Calculator featuring pre-filled real 3M Company (MMM) financials.
- Real-World Data: Historical data and forward-looking estimates (as indicated in the yellow cells).
- Forecast Flexibility: Adjust forecast assumptions such as revenue growth, EBITDA %, and WACC.
- Automatic Calculations: Quickly observe the effects of your inputs on 3M Company’s (MMM) valuation.
- Professional Tool: Designed for investors, CFOs, consultants, and financial analysts.
- User-Friendly Design: Organized for clarity and ease of use, complete with step-by-step instructions.
Key Features
- Comprehensive 3M Financials: Gain access to precise historical data and forward-looking projections for 3M Company (MMM).
- Adjustable Forecast Parameters: Modify highlighted cells for WACC, growth rates, and profit margins to fit your analysis.
- Real-Time Calculations: Instant updates for DCF, Net Present Value (NPV), and cash flow assessments.
- Interactive Dashboard: User-friendly charts and summaries for clear visualization of your valuation outcomes.
- Suitable for All Levels: An intuitive design tailored for investors, CFOs, and consultants alike.
How It Works
- Step 1: Download the Excel file for 3M Company (MMM).
- Step 2: Review 3M's pre-filled financial data and projections.
- Step 3: Adjust key inputs such as revenue growth, WACC, and tax rates (highlighted cells).
- Step 4: Observe the DCF model update in real-time as you modify assumptions.
- Step 5: Evaluate the outputs and leverage the results for investment strategies.
Why Choose 3M Company (MMM) Products?
- Innovative Solutions: Benefit from cutting-edge technology and research-driven products.
- Proven Quality: Trusted by industries worldwide for reliability and performance.
- Diverse Applications: A wide range of products tailored for various sectors and needs.
- Commitment to Sustainability: Dedicated to environmentally responsible practices and products.
- Expert Support: Access to knowledgeable professionals ready to assist you with your needs.
Who Should Use This Product?
- Individual Investors: Gain insights to make informed decisions regarding buying or selling 3M Company (MMM) stock.
- Financial Analysts: Enhance valuation methodologies with comprehensive financial models tailored for 3M Company (MMM).
- Consultants: Provide clients with precise valuation analysis and recommendations related to 3M Company (MMM).
- Business Owners: Learn from the valuation strategies of established firms like 3M Company (MMM) to inform your own business approach.
- Finance Students: Explore practical valuation techniques using data and case studies from 3M Company (MMM).
What the Template Contains
- Historical Data: Includes 3M Company’s past financials and baseline forecasts.
- DCF and Levered DCF Models: Detailed templates to calculate 3M Company’s intrinsic value.
- WACC Sheet: Pre-built calculations for Weighted Average Cost of Capital.
- Editable Inputs: Modify key drivers like growth rates, EBITDA %, and CAPEX assumptions.
- Quarterly and Annual Statements: A complete breakdown of 3M Company’s financials.
- Interactive Dashboard: Visualize valuation results and projections dynamically.
Disclaimer
All information, articles, and product details provided on this website are for general informational and educational purposes only. We do not claim any ownership over, nor do we intend to infringe upon, any trademarks, copyrights, logos, brand names, or other intellectual property mentioned or depicted on this site. Such intellectual property remains the property of its respective owners, and any references here are made solely for identification or informational purposes, without implying any affiliation, endorsement, or partnership.
We make no representations or warranties, express or implied, regarding the accuracy, completeness, or suitability of any content or products presented. Nothing on this website should be construed as legal, tax, investment, financial, medical, or other professional advice. In addition, no part of this site—including articles or product references—constitutes a solicitation, recommendation, endorsement, advertisement, or offer to buy or sell any securities, franchises, or other financial instruments, particularly in jurisdictions where such activity would be unlawful.
All content is of a general nature and may not address the specific circumstances of any individual or entity. It is not a substitute for professional advice or services. Any actions you take based on the information provided here are strictly at your own risk. You accept full responsibility for any decisions or outcomes arising from your use of this website and agree to release us from any liability in connection with your use of, or reliance upon, the content or products found herein.