
|
تقييم Medicinova ، Inc. (MNOV) DCF |
Fully Editable: Tailor To Your Needs In Excel Or Sheets
Professional Design: Trusted, Industry-Standard Templates
Investor-Approved Valuation Models
MAC/PC Compatible, Fully Unlocked
No Expertise Is Needed; Easy To Follow
MediciNova, Inc. (MNOV) Bundle
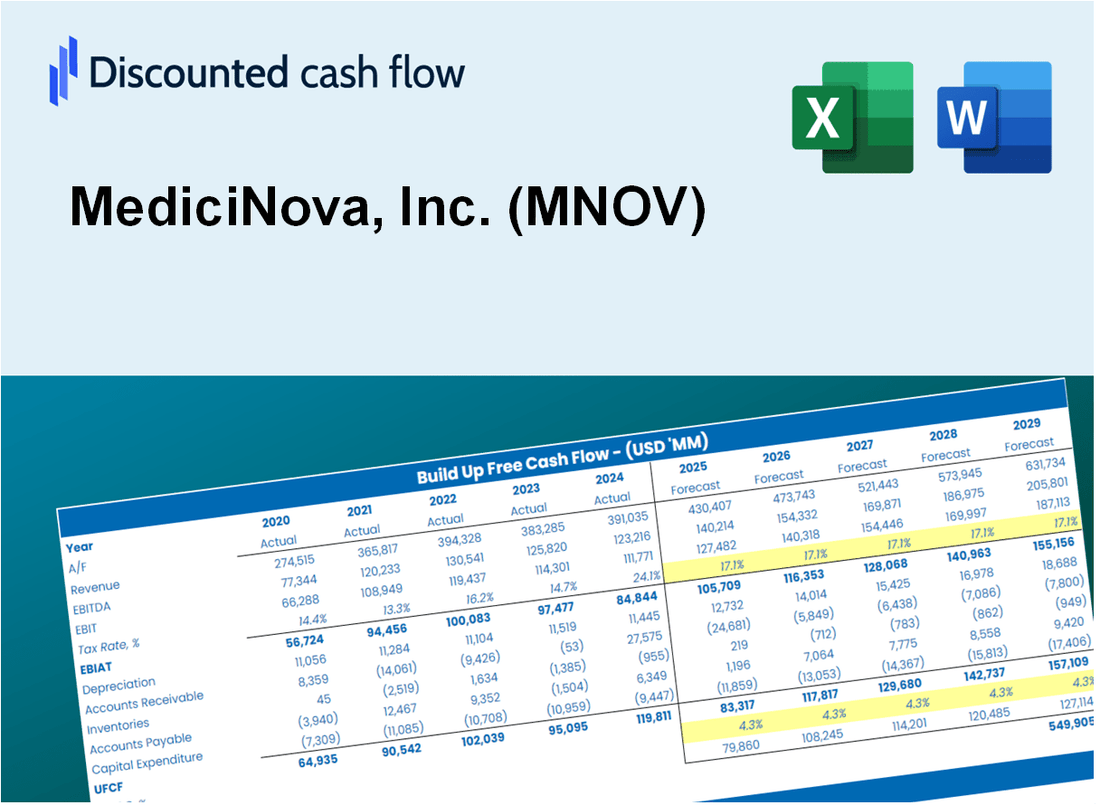
اكتسب نظرة ثاقبة على MediciNova، Inc. (MNOV) تحليل التقييم باستخدام حاسبة DCF المتطورة لدينا! يأتي نموذج Excel هذا محملًا مسبقًا ببيانات MNOV الحقيقية، مما يتيح لك ضبط التوقعات والافتراضات لإجراء حساب دقيق للقيمة الجوهرية لـ MediciNova.
What You Will Get
- Real MNOV Financial Data: Pre-filled with MediciNova’s historical and projected data for precise analysis.
- Fully Editable Template: Modify key inputs like revenue growth, WACC, and EBITDA % with ease.
- Automatic Calculations: See MediciNova’s intrinsic value update instantly based on your changes.
- Professional Valuation Tool: Designed for investors, analysts, and consultants seeking accurate DCF results.
- User-Friendly Design: Simple structure and clear instructions for all experience levels.
Key Features
- Comprehensive Data: MediciNova's historical financial statements and pre-filled projections.
- Customizable Inputs: Modify WACC, tax rates, revenue growth, and EBITDA margins as needed.
- Real-Time Results: Observe MediciNova's intrinsic value recalculating instantly.
- Intuitive Visual Outputs: Dashboard charts illustrate valuation results and essential metrics.
- Designed for Precision: A professional-grade tool tailored for analysts, investors, and finance professionals.
How It Works
- Step 1: Download the prebuilt Excel template with MediciNova, Inc. (MNOV) data included.
- Step 2: Explore the pre-filled sheets and familiarize yourself with the key metrics.
- Step 3: Update forecasts and assumptions in the editable yellow cells (WACC, growth, margins).
- Step 4: Instantly view recalculated results, including MediciNova, Inc. (MNOV)'s intrinsic value.
- Step 5: Make informed investment decisions or generate reports using the outputs.
Why Choose This Calculator for MediciNova, Inc. (MNOV)?
- Comprehensive Tool: Offers DCF, WACC, and financial ratio analyses tailored for MediciNova, Inc. (MNOV).
- Customizable Inputs: Modify yellow-highlighted cells to explore different financial scenarios for MediciNova, Inc. (MNOV).
- Detailed Insights: Automatically computes MediciNova, Inc. (MNOV)’s intrinsic value and Net Present Value.
- Preloaded Data: Features historical and forecasted data specific to MediciNova, Inc. (MNOV) for precise analysis.
- Professional Quality: Perfect for financial analysts, investors, and consultants focusing on MediciNova, Inc. (MNOV).
Who Should Use This Product?
- Healthcare Researchers: Explore innovative treatment options and analyze clinical trial data relevant to MediciNova, Inc. (MNOV).
- Pharmaceutical Academics: Integrate advanced models into your studies or research projects involving drug development.
- Investors: Evaluate your investment strategies and assess the potential of MediciNova, Inc. (MNOV) in the biotech sector.
- Market Analysts: Enhance your analysis with a customizable financial model tailored for biotech firms like MediciNova, Inc. (MNOV).
- Entrepreneurs: Understand the valuation processes of publicly traded biotech companies and apply these insights to your own ventures.
What the Template Contains
- Pre-Filled Data: Includes MediciNova’s historical financials and forecasts.
- Discounted Cash Flow Model: Editable DCF valuation model with automatic calculations.
- Weighted Average Cost of Capital (WACC): A dedicated sheet for calculating WACC based on custom inputs.
- Key Financial Ratios: Analyze MediciNova’s profitability, efficiency, and leverage.
- Customizable Inputs: Edit revenue growth, margins, and tax rates with ease.
- Clear Dashboard: Charts and tables summarizing key valuation results.
Disclaimer
All information, articles, and product details provided on this website are for general informational and educational purposes only. We do not claim any ownership over, nor do we intend to infringe upon, any trademarks, copyrights, logos, brand names, or other intellectual property mentioned or depicted on this site. Such intellectual property remains the property of its respective owners, and any references here are made solely for identification or informational purposes, without implying any affiliation, endorsement, or partnership.
We make no representations or warranties, express or implied, regarding the accuracy, completeness, or suitability of any content or products presented. Nothing on this website should be construed as legal, tax, investment, financial, medical, or other professional advice. In addition, no part of this site—including articles or product references—constitutes a solicitation, recommendation, endorsement, advertisement, or offer to buy or sell any securities, franchises, or other financial instruments, particularly in jurisdictions where such activity would be unlawful.
All content is of a general nature and may not address the specific circumstances of any individual or entity. It is not a substitute for professional advice or services. Any actions you take based on the information provided here are strictly at your own risk. You accept full responsibility for any decisions or outcomes arising from your use of this website and agree to release us from any liability in connection with your use of, or reliance upon, the content or products found herein.