
|
N- able ، Inc. (NABL) DCF تقييم |
Fully Editable: Tailor To Your Needs In Excel Or Sheets
Professional Design: Trusted, Industry-Standard Templates
Investor-Approved Valuation Models
MAC/PC Compatible, Fully Unlocked
No Expertise Is Needed; Easy To Follow
N-able, Inc. (NABL) Bundle
سواء كنت مستثمرًا أو محللًا ، فإن حاسبة DCF (NABL) هذه هي أداةك الأساسية للتقييم الدقيق. محملة بالبيانات الحقيقية من N- Abel ، Inc. ، يمكنك ضبط التنبؤات ومراقبة التأثيرات فورًا.
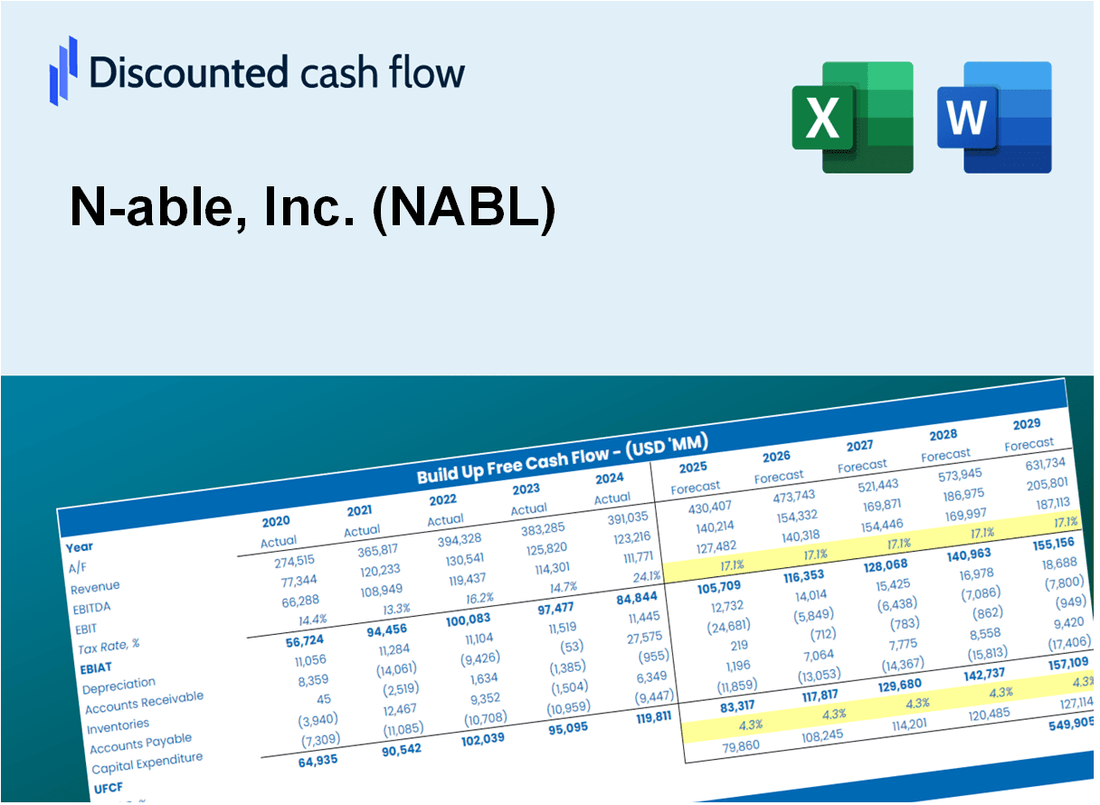
Discounted Cash Flow (DCF) - (USD MM)
| Year | AY1 2020 |
AY2 2021 |
AY3 2022 |
AY4 2023 |
AY5 2024 |
FY1 2025 |
FY2 2026 |
FY3 2027 |
FY4 2028 |
FY5 2029 |
|---|---|---|---|---|---|---|---|---|---|---|
| Revenue | 302.9 | 346.5 | 371.8 | 421.9 | 466.1 | 519.4 | 578.7 | 644.7 | 718.3 | 800.4 |
| Revenue Growth, % | 0 | 14.39 | 7.31 | 13.48 | 10.49 | 11.42 | 11.42 | 11.42 | 11.42 | 11.42 |
| EBITDA | 89.4 | 65.1 | 72.5 | 94.7 | 110.0 | 118.3 | 131.8 | 146.8 | 163.6 | 182.3 |
| EBITDA, % | 29.53 | 18.79 | 19.51 | 22.44 | 23.6 | 22.77 | 22.77 | 22.77 | 22.77 | 22.77 |
| Depreciation | 56.5 | 33.0 | 23.3 | 20.1 | 25.7 | 46.4 | 51.7 | 57.7 | 64.2 | 71.6 |
| Depreciation, % | 18.64 | 9.53 | 6.26 | 4.76 | 5.52 | 8.94 | 8.94 | 8.94 | 8.94 | 8.94 |
| EBIT | 33.0 | 32.1 | 49.3 | 74.6 | 84.3 | 71.8 | 80.0 | 89.2 | 99.4 | 110.7 |
| EBIT, % | 10.89 | 9.25 | 13.25 | 17.68 | 18.08 | 13.83 | 13.83 | 13.83 | 13.83 | 13.83 |
| Total Cash | 99.8 | 66.7 | 98.8 | 153.0 | 85.2 | 138.5 | 154.3 | 172.0 | 191.6 | 213.5 |
| Total Cash, percent | .0 | .0 | .0 | .0 | .0 | .0 | .0 | .0 | .0 | .0 |
| Account Receivables | 30.3 | 40.3 | 42.6 | 48.0 | 85.4 | 65.2 | 72.7 | 81.0 | 90.2 | 100.6 |
| Account Receivables, % | 10.02 | 11.63 | 11.46 | 11.38 | 18.32 | 12.56 | 12.56 | 12.56 | 12.56 | 12.56 |
| Inventories | .0 | .0 | .0 | .0 | .0 | .0 | .0 | .0 | .0 | .0 |
| Inventories, % | 0 | 0 | 0 | 0 | 0 | 0 | 0 | 0 | 0 | 0 |
| Accounts Payable | 5.5 | 5.9 | 3.5 | 5.2 | 6.3 | 7.3 | 8.2 | 9.1 | 10.2 | 11.3 |
| Accounts Payable, % | 1.83 | 1.69 | 0.95328 | 1.24 | 1.35 | 1.41 | 1.41 | 1.41 | 1.41 | 1.41 |
| Capital Expenditure | -16.1 | -34.8 | -21.0 | -22.3 | -17.6 | -31.3 | -34.8 | -38.8 | -43.2 | -48.2 |
| Capital Expenditure, % | -5.33 | -10.05 | -5.65 | -5.29 | -3.77 | -6.02 | -6.02 | -6.02 | -6.02 | -6.02 |
| Tax Rate, % | 42.96 | 42.96 | 42.96 | 42.96 | 42.96 | 42.96 | 42.96 | 42.96 | 42.96 | 42.96 |
| EBITAT | -48.6 | .3 | 27.1 | 39.4 | 48.1 | 23.8 | 26.5 | 29.6 | 32.9 | 36.7 |
| Depreciation | ||||||||||
| Changes in Account Receivables | ||||||||||
| Changes in Inventories | ||||||||||
| Changes in Accounts Payable | ||||||||||
| Capital Expenditure | ||||||||||
| UFCF | -33.1 | -11.1 | 24.7 | 33.4 | 19.9 | 60.2 | 36.8 | 41.0 | 45.7 | 50.9 |
| WACC, % | 5.25 | 5.27 | 6.17 | 6.14 | 6.21 | 5.81 | 5.81 | 5.81 | 5.81 | 5.81 |
| PV UFCF | ||||||||||
| SUM PV UFCF | 199.3 | |||||||||
| Long Term Growth Rate, % | 4.00 | |||||||||
| Free cash flow (T + 1) | 53 | |||||||||
| Terminal Value | 2,931 | |||||||||
| Present Terminal Value | 2,210 | |||||||||
| Enterprise Value | 2,410 | |||||||||
| Net Debt | 284 | |||||||||
| Equity Value | 2,126 | |||||||||
| Diluted Shares Outstanding, MM | 188 | |||||||||
| Equity Value Per Share | 11.28 |
What You Will Receive
- Customizable Excel Template: A fully adjustable Excel-based DCF Calculator featuring pre-filled real N-able financials.
- Accurate Data: Historical performance data and forward-looking estimates (highlighted in the yellow cells).
- Flexible Forecasting: Modify forecast assumptions such as revenue growth, EBITDA %, and WACC.
- Instant Calculations: Quickly observe how your inputs affect N-able's valuation.
- Professional Resource: Designed for investors, CFOs, consultants, and financial analysts.
- Intuitive Interface: Organized for clarity and ease of navigation, complete with step-by-step guidance.
Key Features
- Comprehensive DCF Calculator: Features both unlevered and levered DCF valuation models tailored for N-able, Inc. (NABL).
- WACC Calculation Tool: Pre-configured Weighted Average Cost of Capital template with adjustable parameters.
- Customizable Forecast Inputs: Adjust growth projections, capital expenditures, and discount rates as needed.
- Integrated Financial Ratios: Evaluate profitability, leverage, and efficiency ratios specific to N-able, Inc. (NABL).
- Interactive Dashboard and Visuals: Graphical representations highlight essential valuation metrics for straightforward analysis.
How It Works
- 1. Access the Template: Download and open the Excel file featuring N-able, Inc.'s (NABL) preloaded data.
- 2. Modify Assumptions: Adjust key inputs such as growth rates, WACC, and capital expenditures.
- 3. View Results Instantly: The DCF model automatically calculates intrinsic value and NPV in real-time.
- 4. Explore Scenarios: Analyze multiple forecasts to evaluate different valuation outcomes.
- 5. Present with Assurance: Deliver professional valuation insights to back your decisions confidently.
Why Choose This Calculator for N-able, Inc. (NABL)?
- User-Friendly Interface: Tailored for both novices and seasoned professionals.
- Customizable Inputs: Adjust parameters easily to suit your specific analysis.
- Real-Time Feedback: Watch N-able's valuation update instantly as you modify inputs.
- Preloaded Data: Comes with N-able’s actual financial metrics for immediate evaluation.
- Relied Upon by Experts: Trusted by investors and analysts for making well-informed choices.
Who Should Use N-able, Inc. (NABL)?
- IT Professionals: Enhance your skills by utilizing advanced tools for network management and monitoring.
- Managed Service Providers: Integrate N-able's solutions to improve service delivery and client satisfaction.
- Cybersecurity Experts: Leverage N-able's security features to protect client data and infrastructure.
- Business Owners: Optimize your IT operations with scalable solutions tailored for your company's needs.
- Tech Enthusiasts: Explore innovative technologies that drive efficiency in IT management.
What the Template Contains
- Pre-Filled Data: Includes N-able, Inc.'s historical financials and forecasts.
- Discounted Cash Flow Model: Editable DCF valuation model with automatic calculations.
- Weighted Average Cost of Capital (WACC): A dedicated sheet for calculating WACC based on custom inputs.
- Key Financial Ratios: Analyze N-able, Inc.'s profitability, efficiency, and leverage.
- Customizable Inputs: Edit revenue growth, margins, and tax rates with ease.
- Clear Dashboard: Charts and tables summarizing key valuation results.
Disclaimer
All information, articles, and product details provided on this website are for general informational and educational purposes only. We do not claim any ownership over, nor do we intend to infringe upon, any trademarks, copyrights, logos, brand names, or other intellectual property mentioned or depicted on this site. Such intellectual property remains the property of its respective owners, and any references here are made solely for identification or informational purposes, without implying any affiliation, endorsement, or partnership.
We make no representations or warranties, express or implied, regarding the accuracy, completeness, or suitability of any content or products presented. Nothing on this website should be construed as legal, tax, investment, financial, medical, or other professional advice. In addition, no part of this site—including articles or product references—constitutes a solicitation, recommendation, endorsement, advertisement, or offer to buy or sell any securities, franchises, or other financial instruments, particularly in jurisdictions where such activity would be unlawful.
All content is of a general nature and may not address the specific circumstances of any individual or entity. It is not a substitute for professional advice or services. Any actions you take based on the information provided here are strictly at your own risk. You accept full responsibility for any decisions or outcomes arising from your use of this website and agree to release us from any liability in connection with your use of, or reliance upon, the content or products found herein.