
|
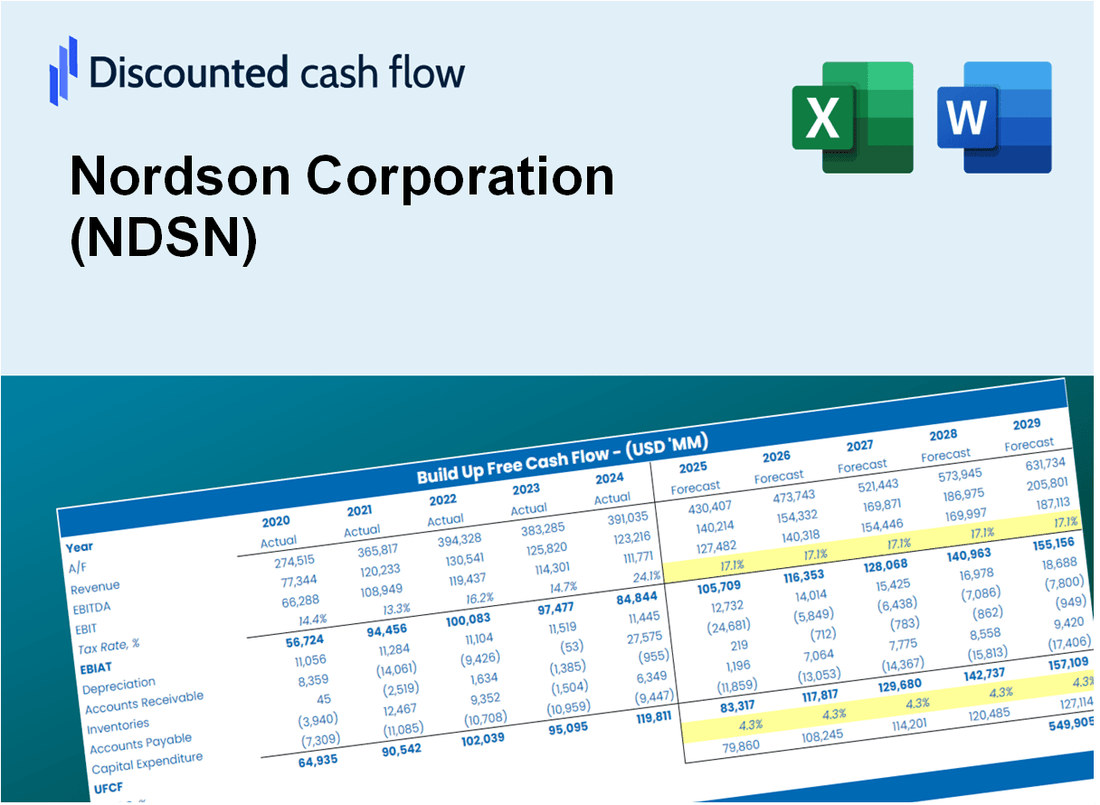
تقييم Nordson Corporation (NDSN) DCF |
Fully Editable: Tailor To Your Needs In Excel Or Sheets
Professional Design: Trusted, Industry-Standard Templates
Investor-Approved Valuation Models
MAC/PC Compatible, Fully Unlocked
No Expertise Is Needed; Easy To Follow
Nordson Corporation (NDSN) Bundle
استكشف آفاق Nordson Corporation (NDSN) مع حاسبة DCF سهلة الاستخدام! أدخل افتراضاتك المتعلقة بالنمو والهوامش والتكاليف لتحديد القيمة الجوهرية لشركة Nordson Corporation (NDSN) وتشكيل قرارات الاستثمار الخاصة بك.
Discounted Cash Flow (DCF) - (USD MM)
| Year | AY1 2020 |
AY2 2021 |
AY3 2022 |
AY4 2023 |
AY5 2024 |
FY1 2025 |
FY2 2026 |
FY3 2027 |
FY4 2028 |
FY5 2029 |
|---|---|---|---|---|---|---|---|---|---|---|
| Revenue | 2,121.1 | 2,362.2 | 2,590.3 | 2,628.6 | 2,689.9 | 2,856.9 | 3,034.3 | 3,222.7 | 3,422.8 | 3,635.3 |
| Revenue Growth, % | 0 | 11.37 | 9.65 | 1.48 | 2.33 | 6.21 | 6.21 | 6.21 | 6.21 | 6.21 |
| EBITDA | 447.0 | 703.6 | 771.6 | 786.7 | 810.6 | 804.0 | 853.9 | 906.9 | 963.2 | 1,023.0 |
| EBITDA, % | 21.07 | 29.78 | 29.79 | 29.93 | 30.13 | 28.14 | 28.14 | 28.14 | 28.14 | 28.14 |
| Depreciation | 113.3 | 103.9 | 99.9 | 111.9 | 136.2 | 130.9 | 139.1 | 147.7 | 156.9 | 166.6 |
| Depreciation, % | 5.34 | 4.4 | 3.86 | 4.26 | 5.06 | 4.58 | 4.58 | 4.58 | 4.58 | 4.58 |
| EBIT | 333.6 | 599.7 | 671.7 | 674.8 | 674.4 | 673.0 | 714.8 | 759.2 | 806.3 | 856.4 |
| EBIT, % | 15.73 | 25.39 | 25.93 | 25.67 | 25.07 | 23.56 | 23.56 | 23.56 | 23.56 | 23.56 |
| Total Cash | 208.3 | 300.0 | 163.5 | 115.7 | 116.0 | 214.5 | 227.8 | 242.0 | 257.0 | 272.9 |
| Total Cash, percent | .0 | .0 | .0 | .0 | .0 | .0 | .0 | .0 | .0 | .0 |
| Account Receivables | 471.9 | 489.4 | 537.3 | 590.9 | 594.7 | 618.8 | 657.2 | 698.0 | 741.3 | 787.4 |
| Account Receivables, % | 22.25 | 20.72 | 20.74 | 22.48 | 22.11 | 21.66 | 21.66 | 21.66 | 21.66 | 21.66 |
| Inventories | 277.0 | 327.2 | 383.4 | 454.8 | 476.9 | 438.5 | 465.7 | 494.6 | 525.4 | 558.0 |
| Inventories, % | 13.06 | 13.85 | 14.8 | 17.3 | 17.73 | 15.35 | 15.35 | 15.35 | 15.35 | 15.35 |
| Accounts Payable | 70.9 | 91.7 | 99.3 | 106.3 | 97.8 | 107.1 | 113.7 | 120.8 | 128.3 | 136.3 |
| Accounts Payable, % | 3.34 | 3.88 | 3.83 | 4.04 | 3.64 | 3.75 | 3.75 | 3.75 | 3.75 | 3.75 |
| Capital Expenditure | -50.5 | -38.3 | -51.4 | -34.6 | -64.4 | -55.4 | -58.9 | -62.5 | -66.4 | -70.5 |
| Capital Expenditure, % | -2.38 | -1.62 | -1.99 | -1.32 | -2.39 | -1.94 | -1.94 | -1.94 | -1.94 | -1.94 |
| Tax Rate, % | 20.19 | 20.19 | 20.19 | 20.19 | 20.19 | 20.19 | 20.19 | 20.19 | 20.19 | 20.19 |
| EBITAT | 276.2 | 474.5 | 530.8 | 534.6 | 538.3 | 538.4 | 571.8 | 607.3 | 645.0 | 685.1 |
| Depreciation | ||||||||||
| Changes in Account Receivables | ||||||||||
| Changes in Inventories | ||||||||||
| Changes in Accounts Payable | ||||||||||
| Capital Expenditure | ||||||||||
| UFCF | -339.0 | 493.2 | 482.8 | 494.0 | 575.6 | 637.5 | 593.0 | 629.8 | 669.0 | 710.5 |
| WACC, % | 7.75 | 7.73 | 7.73 | 7.73 | 7.73 | 7.73 | 7.73 | 7.73 | 7.73 | 7.73 |
| PV UFCF | ||||||||||
| SUM PV UFCF | 2,592.5 | |||||||||
| Long Term Growth Rate, % | 4.00 | |||||||||
| Free cash flow (T + 1) | 739 | |||||||||
| Terminal Value | 19,792 | |||||||||
| Present Terminal Value | 13,638 | |||||||||
| Enterprise Value | 16,230 | |||||||||
| Net Debt | 2,204 | |||||||||
| Equity Value | 14,026 | |||||||||
| Diluted Shares Outstanding, MM | 58 | |||||||||
| Equity Value Per Share | 243.44 |
What You Will Get
- Editable Forecast Inputs: Effortlessly modify key assumptions (growth %, margins, WACC) to explore various scenarios.
- Real-World Data: Nordson Corporation’s financial information pre-loaded to streamline your analysis.
- Automatic DCF Outputs: The template computes Net Present Value (NPV) and intrinsic value automatically.
- Customizable and Professional: A refined Excel model that adjusts to meet your valuation requirements.
- Built for Analysts and Investors: Perfect for evaluating projections, confirming strategies, and enhancing efficiency.
Key Features
- Comprehensive Nordson Financials: Gain access to precise pre-loaded historical data and future estimates for Nordson Corporation (NDSN).
- Adjustable Forecast Parameters: Modify highlighted cells for variables such as WACC, growth rates, and profit margins.
- Real-Time Calculations: Automatic adjustments to DCF, Net Present Value (NPV), and cash flow evaluations.
- Interactive Dashboard: User-friendly charts and summaries to help visualize your valuation outcomes.
- Designed for All Skill Levels: An intuitive layout tailored for investors, CFOs, and consultants alike.
How It Works
- Step 1: Download the Excel file for Nordson Corporation (NDSN).
- Step 2: Review Nordson's pre-filled financial data and forecasts.
- Step 3: Modify key inputs such as revenue growth, WACC, and tax rates (highlighted cells).
- Step 4: Observe the DCF model update in real-time as you adjust assumptions.
- Step 5: Analyze the results and leverage them for your investment decisions.
Why Choose This Calculator for Nordson Corporation (NDSN)?
- All-in-One Solution: Combines DCF, WACC, and comprehensive financial ratio analyses tailored for Nordson Corporation.
- Flexible Inputs: Modify the highlighted cells to explore different financial scenarios for (NDSN).
- In-Depth Analysis: Automatically computes Nordson's intrinsic value and Net Present Value.
- Preloaded Information: Historical and projected data provide reliable baselines for analysis.
- Expert-Level Quality: Perfect for financial analysts, investors, and business consultants focusing on (NDSN).
Who Should Use This Product?
- Investors: Accurately estimate Nordson Corporation’s (NDSN) fair value before making investment decisions.
- CFOs: Leverage a professional-grade DCF model for financial reporting and analysis specific to Nordson Corporation.
- Consultants: Quickly adapt the template for valuation reports tailored for Nordson Corporation clients.
- Entrepreneurs: Gain insights into financial modeling practices utilized by industry leaders like Nordson Corporation.
- Educators: Use it as a teaching tool to demonstrate valuation methodologies relevant to Nordson Corporation.
What the Template Contains
- Pre-Filled DCF Model: Nordson Corporation’s (NDSN) financial data preloaded for immediate use.
- WACC Calculator: Detailed calculations for Weighted Average Cost of Capital.
- Financial Ratios: Evaluate Nordson Corporation’s (NDSN) profitability, leverage, and efficiency.
- Editable Inputs: Change assumptions such as growth, margins, and CAPEX to fit your scenarios.
- Financial Statements: Annual and quarterly reports to support detailed analysis.
- Interactive Dashboard: Easily visualize key valuation metrics and results.
Disclaimer
All information, articles, and product details provided on this website are for general informational and educational purposes only. We do not claim any ownership over, nor do we intend to infringe upon, any trademarks, copyrights, logos, brand names, or other intellectual property mentioned or depicted on this site. Such intellectual property remains the property of its respective owners, and any references here are made solely for identification or informational purposes, without implying any affiliation, endorsement, or partnership.
We make no representations or warranties, express or implied, regarding the accuracy, completeness, or suitability of any content or products presented. Nothing on this website should be construed as legal, tax, investment, financial, medical, or other professional advice. In addition, no part of this site—including articles or product references—constitutes a solicitation, recommendation, endorsement, advertisement, or offer to buy or sell any securities, franchises, or other financial instruments, particularly in jurisdictions where such activity would be unlawful.
All content is of a general nature and may not address the specific circumstances of any individual or entity. It is not a substitute for professional advice or services. Any actions you take based on the information provided here are strictly at your own risk. You accept full responsibility for any decisions or outcomes arising from your use of this website and agree to release us from any liability in connection with your use of, or reliance upon, the content or products found herein.