
|
Newmont Corporation (NEM) DCF تقييم |
Fully Editable: Tailor To Your Needs In Excel Or Sheets
Professional Design: Trusted, Industry-Standard Templates
Investor-Approved Valuation Models
MAC/PC Compatible, Fully Unlocked
No Expertise Is Needed; Easy To Follow
Newmont Corporation (NEM) Bundle
تبحث لتحديد القيمة الجوهرية لشركة نيومونت؟ تدمج حاسبة NEM (NEM) DCF بيانات العالم الحقيقي مع خيارات تخصيص واسعة ، مما يتيح لك ضبط توقعاتك واتخاذ خيارات استثمار أكثر استنارة.
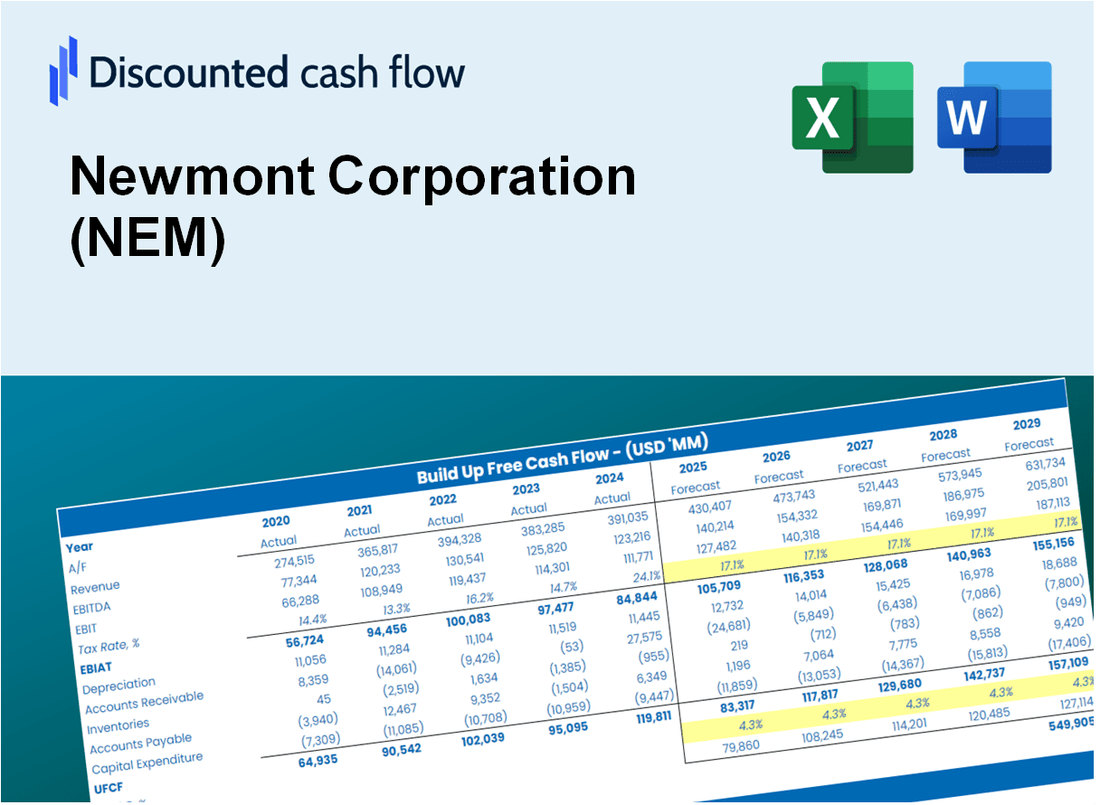
Discounted Cash Flow (DCF) - (USD MM)
| Year | AY1 2020 |
AY2 2021 |
AY3 2022 |
AY4 2023 |
AY5 2024 |
FY1 2025 |
FY2 2026 |
FY3 2027 |
FY4 2028 |
FY5 2029 |
|---|---|---|---|---|---|---|---|---|---|---|
| Revenue | 11,417.0 | 12,190.0 | 11,949.0 | 11,775.0 | 18,557.0 | 21,383.9 | 24,641.4 | 28,395.1 | 32,720.7 | 37,705.2 |
| Revenue Growth, % | 0 | 6.77 | -1.98 | -1.46 | 57.6 | 15.23 | 15.23 | 15.23 | 15.23 | 15.23 |
| EBITDA | 6,100.0 | 5,543.0 | 3,282.0 | 1,858.0 | 7,866.0 | 7,892.2 | 9,094.4 | 10,479.8 | 12,076.2 | 13,915.9 |
| EBITDA, % | 53.43 | 45.47 | 27.47 | 15.78 | 42.39 | 36.91 | 36.91 | 36.91 | 36.91 | 36.91 |
| Depreciation | 2,666.0 | 4,169.0 | 3,106.0 | 3,641.0 | 2,904.0 | 5,564.8 | 6,412.5 | 7,389.3 | 8,515.0 | 9,812.1 |
| Depreciation, % | 23.35 | 34.2 | 25.99 | 30.92 | 15.65 | 26.02 | 26.02 | 26.02 | 26.02 | 26.02 |
| EBIT | 3,434.0 | 1,374.0 | 176.0 | -1,783.0 | 4,962.0 | 2,327.4 | 2,681.9 | 3,090.5 | 3,561.3 | 4,103.8 |
| EBIT, % | 30.08 | 11.27 | 1.47 | -15.14 | 26.74 | 10.88 | 10.88 | 10.88 | 10.88 | 10.88 |
| Total Cash | 5,830.0 | 5,074.0 | 3,757.0 | 3,025.0 | 3,640.0 | 7,246.4 | 8,350.3 | 9,622.3 | 11,088.1 | 12,777.2 |
| Total Cash, percent | .0 | .0 | .0 | .0 | .0 | .0 | .0 | .0 | .0 | .0 |
| Account Receivables | 449.0 | 337.0 | 690.0 | 1,227.0 | 1,056.0 | 1,222.4 | 1,408.6 | 1,623.2 | 1,870.5 | 2,155.4 |
| Account Receivables, % | 3.93 | 2.76 | 5.77 | 10.42 | 5.69 | 5.72 | 5.72 | 5.72 | 5.72 | 5.72 |
| Inventories | 1,790.0 | 1,787.0 | 1,753.0 | 2,642.0 | 2,184.0 | 3,387.9 | 3,903.9 | 4,498.6 | 5,184.0 | 5,973.6 |
| Inventories, % | 15.68 | 14.66 | 14.67 | 22.44 | 11.77 | 15.84 | 15.84 | 15.84 | 15.84 | 15.84 |
| Accounts Payable | 493.0 | 518.0 | 633.0 | 960.0 | 843.0 | 1,135.9 | 1,309.0 | 1,508.4 | 1,738.2 | 2,003.0 |
| Accounts Payable, % | 4.32 | 4.25 | 5.3 | 8.15 | 4.54 | 5.31 | 5.31 | 5.31 | 5.31 | 5.31 |
| Capital Expenditure | -1,302.0 | -1,653.0 | -2,131.0 | -2,666.0 | -3,402.0 | -3,582.8 | -4,128.5 | -4,757.5 | -5,482.2 | -6,317.3 |
| Capital Expenditure, % | -11.4 | -13.56 | -17.83 | -22.64 | -18.33 | -16.75 | -16.75 | -16.75 | -16.75 | -16.75 |
| Tax Rate, % | 30.36 | 30.36 | 30.36 | 30.36 | 30.36 | 30.36 | 30.36 | 30.36 | 30.36 | 30.36 |
| EBITAT | 2,915.6 | 1,257.5 | -1,442.6 | -2,284.0 | 3,455.5 | 1,610.9 | 1,856.3 | 2,139.0 | 2,464.9 | 2,840.4 |
| Depreciation | ||||||||||
| Changes in Account Receivables | ||||||||||
| Changes in Inventories | ||||||||||
| Changes in Accounts Payable | ||||||||||
| Capital Expenditure | ||||||||||
| UFCF | 2,533.6 | 3,913.5 | -671.6 | -2,408.0 | 3,469.5 | 2,515.5 | 3,610.9 | 4,161.0 | 4,794.9 | 5,525.3 |
| WACC, % | 5.26 | 5.28 | 4.96 | 5.31 | 5.21 | 5.2 | 5.2 | 5.2 | 5.2 | 5.2 |
| PV UFCF | ||||||||||
| SUM PV UFCF | 17,428.9 | |||||||||
| Long Term Growth Rate, % | 4.00 | |||||||||
| Free cash flow (T + 1) | 5,746 | |||||||||
| Terminal Value | 477,360 | |||||||||
| Present Terminal Value | 370,416 | |||||||||
| Enterprise Value | 387,844 | |||||||||
| Net Debt | 5,353 | |||||||||
| Equity Value | 382,491 | |||||||||
| Diluted Shares Outstanding, MM | 1,148 | |||||||||
| Equity Value Per Share | 333.18 |
What You Will Receive
- Customizable Excel Template: A fully adjustable Excel-based DCF Calculator featuring pre-filled real NEM financials.
- Authentic Data: Historical performance metrics and forward-looking projections (highlighted in the yellow cells).
- Flexible Forecasting: Modify forecast parameters such as revenue growth, EBITDA %, and WACC.
- Instant Calculations: Quickly observe how your inputs affect Newmont Corporation’s valuation.
- Professional Resource: Designed for investors, CFOs, consultants, and financial analysts.
- User-Centric Layout: Organized for clarity and simplicity, complete with step-by-step guidance.
Key Features
- Real-Time NEM Data: Pre-loaded with Newmont Corporation’s historical financials and future projections.
- Comprehensive Customization: Modify inputs such as production rates, gold prices, operating costs, and capital investments.
- Interactive Valuation Model: Instant updates to Net Present Value (NPV) and intrinsic value based on your adjustments.
- Scenario Analysis: Develop various forecast scenarios to evaluate different valuation results.
- Intuitive Interface: Designed to be accessible and efficient for both seasoned professionals and newcomers.
How It Works
- Step 1: Download the Excel file.
- Step 2: Review Newmont Corporation’s (NEM) pre-filled financial data and forecasts.
- Step 3: Adjust key inputs such as gold production estimates, operating costs, and capital expenditures (highlighted cells).
- Step 4: Observe the DCF model refresh in real-time as you change your assumptions.
- Step 5: Evaluate the results and utilize the findings for your investment strategies.
Why Choose Newmont Corporation (NEM)?
- Proven Track Record: A leader in the gold mining industry with a history of successful operations.
- Commitment to Sustainability: Focused on responsible mining practices and environmental stewardship.
- Strong Financial Performance: Consistent revenue growth and robust cash flow generation.
- Innovative Technology: Utilizing advanced mining techniques to enhance efficiency and productivity.
- Experienced Leadership: Guided by a team of industry veterans dedicated to driving value for shareholders.
Who Should Use This Product?
- Mining Students: Understand resource valuation techniques and apply them to real-world mining data.
- Researchers: Integrate industry-standard models into your academic projects or studies.
- Investors: Evaluate your investment strategies and assess valuation outcomes for Newmont Corporation (NEM).
- Financial Analysts: Enhance your analysis with a customizable DCF model tailored for mining companies.
- Industry Professionals: Learn how large mining firms like Newmont Corporation (NEM) are evaluated in the market.
What the Template Contains
- Pre-Filled DCF Model: Newmont Corporation’s financial data preloaded for immediate use.
- WACC Calculator: Detailed calculations for Weighted Average Cost of Capital.
- Financial Ratios: Evaluate Newmont Corporation’s profitability, leverage, and efficiency.
- Editable Inputs: Change assumptions such as growth, margins, and CAPEX to fit your scenarios.
- Financial Statements: Annual and quarterly reports to support detailed analysis.
- Interactive Dashboard: Easily visualize key valuation metrics and results.
Disclaimer
All information, articles, and product details provided on this website are for general informational and educational purposes only. We do not claim any ownership over, nor do we intend to infringe upon, any trademarks, copyrights, logos, brand names, or other intellectual property mentioned or depicted on this site. Such intellectual property remains the property of its respective owners, and any references here are made solely for identification or informational purposes, without implying any affiliation, endorsement, or partnership.
We make no representations or warranties, express or implied, regarding the accuracy, completeness, or suitability of any content or products presented. Nothing on this website should be construed as legal, tax, investment, financial, medical, or other professional advice. In addition, no part of this site—including articles or product references—constitutes a solicitation, recommendation, endorsement, advertisement, or offer to buy or sell any securities, franchises, or other financial instruments, particularly in jurisdictions where such activity would be unlawful.
All content is of a general nature and may not address the specific circumstances of any individual or entity. It is not a substitute for professional advice or services. Any actions you take based on the information provided here are strictly at your own risk. You accept full responsibility for any decisions or outcomes arising from your use of this website and agree to release us from any liability in connection with your use of, or reliance upon, the content or products found herein.