
|
NetWeb Technologies India Limited (netweb.ns) تقييم DCF |
Fully Editable: Tailor To Your Needs In Excel Or Sheets
Professional Design: Trusted, Industry-Standard Templates
Investor-Approved Valuation Models
MAC/PC Compatible, Fully Unlocked
No Expertise Is Needed; Easy To Follow
Netweb Technologies India Limited (NETWEB.NS) Bundle
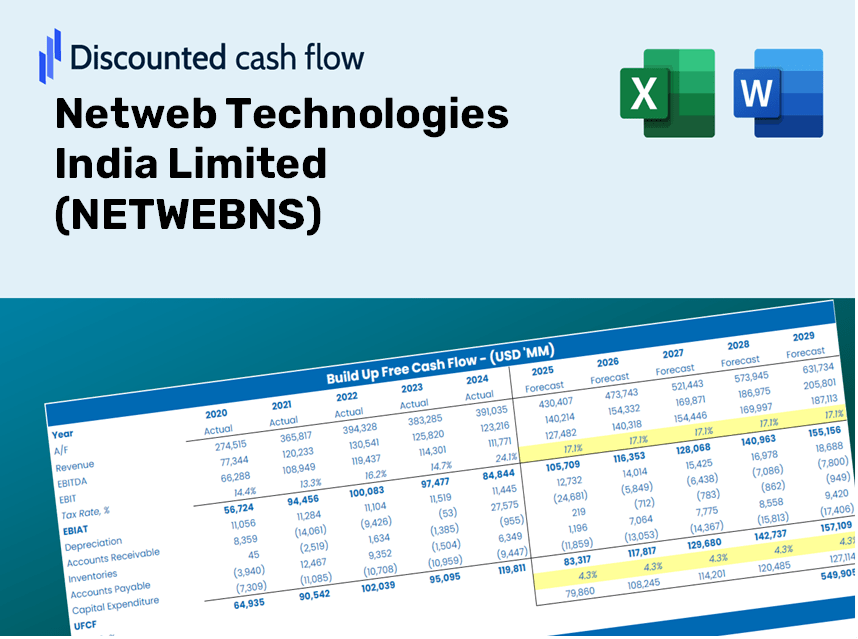
كمستثمر أو محلل ، فإن حاسبة DCF (NetWebNS) هي موردك للتقييم الدقيق. محملة بالبيانات الحقيقية من NetWeb Technologies India Limited ، يمكنك ضبط التنبؤات ومراقبة التأثيرات على الفور.
Discounted Cash Flow (DCF) - (USD MM)
| Year | AY1 2021 |
AY2 2022 |
AY3 2023 |
AY4 2024 |
AY5 2025 |
FY1 2026 |
FY2 2027 |
FY3 2028 |
FY4 2029 |
FY5 2030 |
|---|---|---|---|---|---|---|---|---|---|---|
| Revenue | 1,427.9 | 2,470.3 | 4,449.7 | 7,240.8 | 11,430.8 | 19,253.1 | 32,428.3 | 54,619.4 | 91,996.3 | 154,950.8 |
| Revenue Growth, % | 0 | 73.01 | 80.13 | 62.72 | 57.87 | 68.43 | 68.43 | 68.43 | 68.43 | 68.43 |
| EBITDA | 158.9 | 347.2 | 706.9 | 1,144.2 | 1,576.8 | 2,720.9 | 4,582.9 | 7,719.1 | 13,001.3 | 21,898.4 |
| EBITDA, % | 11.13 | 14.05 | 15.89 | 15.8 | 13.79 | 14.13 | 14.13 | 14.13 | 14.13 | 14.13 |
| Depreciation | 14.5 | 16.4 | 36.6 | 62.5 | 90.1 | 159.9 | 269.4 | 453.7 | 764.2 | 1,287.2 |
| Depreciation, % | 1.02 | 0.66307 | 0.82185 | 0.86345 | 0.7884 | 0.83073 | 0.83073 | 0.83073 | 0.83073 | 0.83073 |
| EBIT | 144.3 | 330.8 | 670.4 | 1,081.6 | 1,486.7 | 2,561.0 | 4,313.5 | 7,265.3 | 12,237.1 | 20,611.1 |
| EBIT, % | 10.11 | 13.39 | 15.07 | 14.94 | 13.01 | 13.3 | 13.3 | 13.3 | 13.3 | 13.3 |
| Total Cash | 20.2 | 20.3 | 70.9 | 896.8 | 1,795.3 | 1,229.2 | 2,070.4 | 3,487.1 | 5,873.4 | 9,892.7 |
| Total Cash, percent | .0 | .0 | .0 | .0 | .0 | .0 | .0 | .0 | .0 | .0 |
| Account Receivables | 568.0 | 784.7 | 1,594.8 | 1,975.6 | 3,615.3 | 6,403.3 | 10,785.2 | 18,165.7 | 30,596.8 | 51,534.7 |
| Account Receivables, % | 39.78 | 31.76 | 35.84 | 27.28 | 31.63 | 33.26 | 33.26 | 33.26 | 33.26 | 33.26 |
| Inventories | 292.2 | 383.2 | 540.7 | 1,146.6 | 2,228.3 | 3,213.5 | 5,412.6 | 9,116.5 | 15,355.0 | 25,862.7 |
| Inventories, % | 20.46 | 15.51 | 12.15 | 15.83 | 19.49 | 16.69 | 16.69 | 16.69 | 16.69 | 16.69 |
| Accounts Payable | 425.9 | 532.9 | 1,033.7 | 1,266.2 | 2,979.3 | 4,550.6 | 7,664.6 | 12,909.7 | 21,744.0 | 36,623.7 |
| Accounts Payable, % | 29.83 | 21.57 | 23.23 | 17.49 | 26.06 | 23.64 | 23.64 | 23.64 | 23.64 | 23.64 |
| Capital Expenditure | -15.7 | -53.8 | -132.6 | -194.7 | -254.8 | -430.4 | -724.9 | -1,221.0 | -2,056.5 | -3,463.8 |
| Capital Expenditure, % | -1.1 | -2.18 | -2.98 | -2.69 | -2.23 | -2.24 | -2.24 | -2.24 | -2.24 | -2.24 |
| Tax Rate, % | 25.65 | 25.65 | 25.65 | 25.65 | 25.65 | 25.65 | 25.65 | 25.65 | 25.65 | 25.65 |
| EBITAT | 107.0 | 245.7 | 499.7 | 805.2 | 1,105.3 | 1,904.2 | 3,207.2 | 5,401.9 | 9,098.5 | 15,324.8 |
| Depreciation | ||||||||||
| Changes in Account Receivables | ||||||||||
| Changes in Inventories | ||||||||||
| Changes in Accounts Payable | ||||||||||
| Capital Expenditure | ||||||||||
| UFCF | -328.4 | 7.6 | -63.3 | -81.0 | -67.6 | -568.2 | -715.2 | -1,204.7 | -2,029.1 | -3,417.6 |
| WACC, % | 12.71 | 12.71 | 12.71 | 12.71 | 12.71 | 12.71 | 12.71 | 12.71 | 12.71 | 12.71 |
| PV UFCF | ||||||||||
| SUM PV UFCF | -5,044.7 | |||||||||
| Long Term Growth Rate, % | 2.00 | |||||||||
| Free cash flow (T + 1) | -3,486 | |||||||||
| Terminal Value | -32,547 | |||||||||
| Present Terminal Value | -17,893 | |||||||||
| Enterprise Value | -22,938 | |||||||||
| Net Debt | -1,716 | |||||||||
| Equity Value | -21,222 | |||||||||
| Diluted Shares Outstanding, MM | 57 | |||||||||
| Equity Value Per Share | -375.21 |
فوائد اختيار NetWeb Technologies India Limited (NetWebns)
- بيانات NetWebNS الشاملة: الوصول إلى البيانات التاريخية والمتوقعة للتقييم الدقيق.
- المعلمات القابلة للتخصيص: اضبط WACC ، ومعدلات الضرائب ، ونمو الإيرادات ، والنفقات الرأسمالية لتناسب تحليلك.
- الحسابات الديناميكية: يتم حساب القيمة الجوهرية و NPV في الوقت الفعلي.
- اختبار السيناريو: تحليل السيناريوهات المختلفة لتقييم الإمكانات المستقبلية لتقنيات NetWeb.
- تصميم سهل الاستخدام: مصمم خصيصًا للمهنيين في هذا المجال مع البقاء ودودين للوافدين الجدد.
الميزات الرئيسية
- 🔍 بيانات NetWebns المالية الواقعية: البيانات التاريخية والمتوقعة المليئة مسبقًا بتقنيات NetWeb India Limited.
- ✏️ مدخلات قابلة للتخصيص بالكامل: تعديل جميع المعلمات الأساسية (الخلايا المميزة) مثل WACC و Growth ٪ ومعدلات الضرائب.
- 📊 تقييم DCF المهني: الصيغ المتكاملة حساب القيمة الجوهرية لتقنيات NetWeb باستخدام طريقة التدفق النقدي المخفض.
- ⚡ النتائج الفورية: عرض تقييم NetWeb فور إجراء التعديلات.
- تحليل السيناريو: تقييم ومقارنة مختلف السيناريوهات المالية جنبًا إلى جنب.
كيف يعمل
- الخطوة 1: قم بتنزيل جدول بيانات Excel.
- الخطوة 2: فحص البيانات المعبأة مسبقًا لتقنيات Netweb (NETWEBNS) بما في ذلك الأرقام التاريخية والمتوقعة.
- الخطوة 3: قم بتعديل الافتراضات الرئيسية (المميزة باللون الأصفر) بناءً على بحثك.
- الخطوة 4: لاحظ إعادة حساب القيمة الجوهرية لشركة Netweb Technologies في الوقت الفعلي.
- الخطوة 5: الاستفادة من النتائج لاستراتيجيات الاستثمار الخاصة بك أو احتياجات الإبلاغ.
لماذا تختار هذه الآلة الحاسبة ؟
- مصممة للخبراء: أداة متطورة مصممة للمحللين والمسؤولين الماليين والاستشاريين.
- بيانات الوقت الفعلي: تم تحميل البيانات المالية التاريخية والمتوقعة لشركة Netweb Technologies India Limited (NETWEBNS) مسبقًا للدقة.
- تحليل السيناريو: محاكاة التوقعات والافتراضات المختلفة دون عناء.
- المخرجات الموجزة: يحسب تلقائيًا القيمة الجوهرية و NPV والمقاييس الأساسية.
- سهل الاستخدام: إرشادات خطوة بخطوة لمساعدتك على التنقل في العملية.
من يمكنه الاستفادة من هذا المنتج؟
- المستثمرون: تقييم تقييم NetWeb Technologies India Limited (NETWEBNS) قبل اتخاذ قرارات الاستثمار.
- الماليين والمحللين الماليين: تحسين سير عمل تقييم وتقييم التوقعات المالية.
- مؤسسو الشركات الناشئة: اكتساب رؤى حول كيفية تقدير الشركات المعروفة مثل NetWeb Technologies.
- الاستشاريون: تقديم تقارير تقييم شاملة لعملائك يضم netwebns.
- الطلاب والمعلمين: الاستفادة من أمثلة في العالم الحقيقي لاستكشاف وتعليم منهجيات التقييم.
محتويات القالب
- البيانات المليئة مسبقا: يحتوي على البيانات المالية والتوقعات التاريخية لـ NetWeb Technologies India Limited (NetWebns).
- نموذج التدفق النقدي المخفض: نموذج تقييم DCF قابل للتحرير يتميز بحسابات تلقائية.
- متوسط تكلفة رأس المال المرجح (WACC): ورقة محددة لحساب WACC بناءً على مدخلاتك المخصصة.
- النسب المالية الرئيسية: تقييم مقاييس NetWeb والكفاءة والرافعة المالية.
- مدخلات قابلة للتخصيص: بسهولة ضبط نمو الإيرادات ، هوامش الربح ، ومعدلات الضرائب.
- لوحة القيادة الصافية: التمثيلات المرئية والجداول التي تلخص نتائج التقييم الرئيسية.
Disclaimer
All information, articles, and product details provided on this website are for general informational and educational purposes only. We do not claim any ownership over, nor do we intend to infringe upon, any trademarks, copyrights, logos, brand names, or other intellectual property mentioned or depicted on this site. Such intellectual property remains the property of its respective owners, and any references here are made solely for identification or informational purposes, without implying any affiliation, endorsement, or partnership.
We make no representations or warranties, express or implied, regarding the accuracy, completeness, or suitability of any content or products presented. Nothing on this website should be construed as legal, tax, investment, financial, medical, or other professional advice. In addition, no part of this site—including articles or product references—constitutes a solicitation, recommendation, endorsement, advertisement, or offer to buy or sell any securities, franchises, or other financial instruments, particularly in jurisdictions where such activity would be unlawful.
All content is of a general nature and may not address the specific circumstances of any individual or entity. It is not a substitute for professional advice or services. Any actions you take based on the information provided here are strictly at your own risk. You accept full responsibility for any decisions or outcomes arising from your use of this website and agree to release us from any liability in connection with your use of, or reliance upon, the content or products found herein.