
|
New India Assurance Company Limited (NIACL.NS) DCF تقييم |
Fully Editable: Tailor To Your Needs In Excel Or Sheets
Professional Design: Trusted, Industry-Standard Templates
Investor-Approved Valuation Models
MAC/PC Compatible, Fully Unlocked
No Expertise Is Needed; Easy To Follow
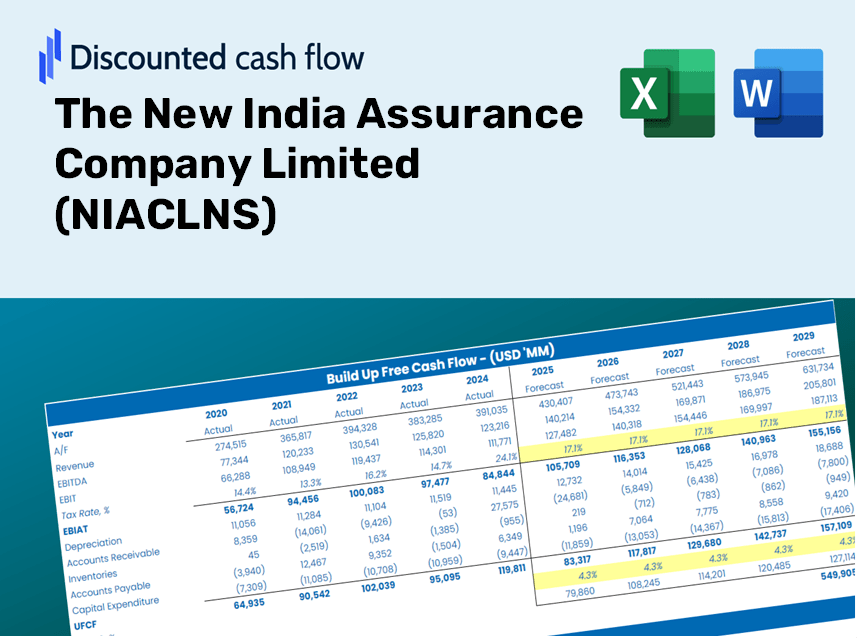
The New India Assurance Company Limited (NIACL.NS) Bundle
تُمكّنك حاسبة DCF (NIACLNS) الخاصة بنا (NIACLNS) لدينا من تقييم تقييم شركة Assurance New India New Limited مع البيانات المالية الفعلية والمرونة الكاملة لتعديل جميع المعلمات الرئيسية للتوقعات المحسنة.
Discounted Cash Flow (DCF) - (USD MM)
| Year | AY1 2021 |
AY2 2022 |
AY3 2023 |
AY4 2024 |
AY5 2025 |
FY1 2026 |
FY2 2027 |
FY3 2028 |
FY4 2029 |
FY5 2030 |
|---|---|---|---|---|---|---|---|---|---|---|
| Revenue | 336,027.1 | 365,322.9 | 418,348.7 | 442,690.8 | 440,636.6 | 472,128.5 | 505,871.2 | 542,025.3 | 580,763.4 | 622,270.1 |
| Revenue Growth, % | 0 | 8.72 | 14.51 | 5.82 | -0.46403 | 7.15 | 7.15 | 7.15 | 7.15 | 7.15 |
| EBITDA | 24,885.3 | 3,484.2 | 14,584.8 | 15,311.6 | 11,736.9 | 16,966.5 | 18,179.1 | 19,478.4 | 20,870.5 | 22,362.1 |
| EBITDA, % | 7.41 | 0.95374 | 3.49 | 3.46 | 2.66 | 3.59 | 3.59 | 3.59 | 3.59 | 3.59 |
| Depreciation | 4,040.0 | 1,364.6 | 1,647.2 | 589.6 | 509.6 | 2,094.7 | 2,244.4 | 2,404.8 | 2,576.7 | 2,760.9 |
| Depreciation, % | 1.2 | 0.37354 | 0.39373 | 0.13319 | 0.11565 | 0.44368 | 0.44368 | 0.44368 | 0.44368 | 0.44368 |
| EBIT | 20,845.3 | 2,119.6 | 12,937.7 | 14,722.0 | 11,227.3 | 14,871.8 | 15,934.7 | 17,073.5 | 18,293.8 | 19,601.2 |
| EBIT, % | 6.2 | 0.5802 | 3.09 | 3.33 | 2.55 | 3.15 | 3.15 | 3.15 | 3.15 | 3.15 |
| Total Cash | 139,388.6 | 138,191.5 | 153,931.9 | 171,917.3 | 177,105.0 | 184,254.1 | 197,422.6 | 211,532.2 | 226,650.3 | 242,848.8 |
| Total Cash, percent | .0 | .0 | .0 | .0 | .0 | .0 | .0 | .0 | .0 | .0 |
| Account Receivables | .0 | 84,740.0 | 76,934.3 | 79,803.3 | 73,730.4 | 72,089.8 | 77,241.9 | 82,762.4 | 88,677.3 | 95,015.0 |
| Account Receivables, % | 0 | 23.2 | 18.39 | 18.03 | 16.73 | 15.27 | 15.27 | 15.27 | 15.27 | 15.27 |
| Inventories | .0 | .0 | .0 | .0 | .0 | .0 | .0 | .0 | .0 | .0 |
| Inventories, % | 0 | 0 | 0 | 0 | 0 | 0 | 0 | 0 | 0 | 0 |
| Accounts Payable | 15,737.1 | 13,886.2 | 10,675.9 | 11,515.8 | 12,197.8 | 15,491.3 | 16,598.5 | 17,784.7 | 19,055.8 | 20,417.7 |
| Accounts Payable, % | 4.68 | 3.8 | 2.55 | 2.6 | 2.77 | 3.28 | 3.28 | 3.28 | 3.28 | 3.28 |
| Capital Expenditure | -989.2 | -1,168.9 | -978.0 | -695.6 | -1,158.5 | -1,197.5 | -1,283.1 | -1,374.8 | -1,473.0 | -1,578.3 |
| Capital Expenditure, % | -0.29438 | -0.31997 | -0.23378 | -0.15713 | -0.26292 | -0.25363 | -0.25363 | -0.25363 | -0.25363 | -0.25363 |
| Tax Rate, % | -1.38 | -1.38 | -1.38 | -1.38 | -1.38 | -1.38 | -1.38 | -1.38 | -1.38 | -1.38 |
| EBITAT | 16,602.0 | 2,322.0 | 10,791.2 | 11,640.0 | 11,382.5 | 13,150.2 | 14,090.0 | 15,097.0 | 16,176.0 | 17,332.1 |
| Depreciation | ||||||||||
| Changes in Account Receivables | ||||||||||
| Changes in Inventories | ||||||||||
| Changes in Accounts Payable | ||||||||||
| Capital Expenditure | ||||||||||
| UFCF | 35,389.9 | -84,073.3 | 16,055.7 | 9,504.9 | 17,488.4 | 18,981.6 | 11,006.4 | 11,793.0 | 12,635.8 | 13,538.9 |
| WACC, % | 8.67 | 8.67 | 8.67 | 8.67 | 8.67 | 8.67 | 8.67 | 8.67 | 8.67 | 8.67 |
| PV UFCF | ||||||||||
| SUM PV UFCF | 53,974.5 | |||||||||
| Long Term Growth Rate, % | 2.00 | |||||||||
| Free cash flow (T + 1) | 13,810 | |||||||||
| Terminal Value | 207,113 | |||||||||
| Present Terminal Value | 136,680 | |||||||||
| Enterprise Value | 190,655 | |||||||||
| Net Debt | -177,105 | |||||||||
| Equity Value | 367,760 | |||||||||
| Diluted Shares Outstanding, MM | 1,648 | |||||||||
| Equity Value Per Share | 223.15 |
الفوائد التي ستتلقاها
- بيانات NIACL المالية الدقيقة: تم تحميلها مسبقًا مع مقاييس شركة India New Assurance Company Limited التاريخية والمتوقعة للتحليل الشامل.
- قالب قابل للتخصيص: تعديل المعلمات الرئيسية بسهولة مثل النمو المتميز ، والنسبة المشتركة ، والمطالبات ٪.
- الحسابات الفورية: راقب التحديثات في الوقت الفعلي لقيمة NIACL الجوهرية أثناء قيامك بإجراء تعديلات.
- أداة التقييم المهنية: مصمم للمستثمرين والمحللين والمستشارين الذين يهدفون إلى تقييمات DCF موثوقة.
- تصميم بديهي: التصميم المنظم والإرشادات الواضحة مناسبة لجميع مستويات الخبرة.
الميزات الرئيسية
- البيانات التي تم تحميلها مسبقًا: البيانات المالية التاريخية والتوقعات المملوءة مسبقًا لشركة Assurance Limited India New India Limited (NIACLNS).
- مدخلات قابلة للتعديل بالكامل: تخصيص WACC ، ومعدلات الضرائب ، والنمو المتميز ، ونسب المطالبات.
- النتائج الفورية: عرض القيمة الجوهرية لـ NIACLNS التي أعيد حسابها في الوقت الفعلي.
- واضحة المخرجات المرئية: توضح مخططات لوحة القيادة نتائج التقييم والمقاييس الأساسية.
- بنيت للدقة: أداة من الدرجة المهنية المصممة للمحللين والمستثمرين والمهنيين الماليين.
كيف تعمل
- الخطوة 1: قم بتنزيل ملف Excel لشركة Assurance New India New India Limited (NIACLNS).
- الخطوة 2: فحص البيانات المالية المملوءة مسبقًا وإسقاطات NIACLNS.
- الخطوة 3: اضبط المدخلات الرئيسية مثل النمو المتميز ، ونسبة المطالبات ، وعوائد الاستثمار (الخلايا المميزة).
- الخطوة 4: راقب تحديث نموذج DCF في الوقت الفعلي أثناء تعديل افتراضاتك.
- الخطوة 5: تقييم النتائج والاستفادة من رؤى خيارات الاستثمار الخاصة بك.
لماذا تختار هذه الآلة الحاسبة؟
- بيانات دقيقة: توفر البيانات المالية الأصلية من شركة Assurance Company Limited (NIACLNS) الجديدة نتائج تقييم يمكن الاعتماد عليها.
- قابل للتخصيص: تخصيص المعلمات الأساسية مثل معدلات النمو و WACC ومعدلات الضرائب لتتماشى مع توقعاتك.
- توفير الوقت: توفر لك الحسابات المدمجة متاعب البدء من الألف إلى الياء.
- أداة الصفوف المهنية: تم تصميمه للاستخدام من قبل المستثمرين والمحللين والمستشارين.
- سهل الاستخدام: يضمن التصميم البديهي والتعليمات الواضحة خطوة بخطوة إمكانية الوصول لجميع المستخدمين.
من يجب أن يستخدم هذا المنتج؟
- المستثمرون: تقييم بدقة القيمة العادلة لشركة Assurance Company New India New Limited (NIACLNS) قبل اتخاذ خيارات الاستثمار.
- المدير المالي: الاستفادة من نموذج DCF من الدرجة المهنية لتقارير وتحليل مالي شامل.
- الاستشاريون: تخصيص القالب بفعالية لتقارير التقييم المصممة لعملائها.
- رواد الأعمال: اكتساب رؤى قيمة في ممارسات النمذجة المالية لقادة الصناعة.
- المعلمون: توظيفها كمورد تعليمي لتوضيح منهجيات التقييم.
محتويات القالب
- نموذج DCF مفصل: قالب قابل للتحرير يضم حسابات التقييم المتعمقة.
- بيانات السوق: المعلومات المالية التاريخية والمتوقعة من NIACLNS تم تحميلها مسبقًا لتحليلك.
- الافتراضات القابلة للتعديل: تعديل WACC ومعدلات النمو والمدخلات الضريبية لاستكشاف سيناريوهات مختلفة.
- التقارير المالية: الانهيارات المالية السنوية والفصلية الشاملة للتفاهم المعزز.
- النسب الأساسية: تحليل متكامل لتقييم الربحية والكفاءة والرافعة المالية.
- لوحة القيادة المرئية: المخططات والجداول التي تقدم رؤى واضحة وقابلة للتنفيذ.
Disclaimer
All information, articles, and product details provided on this website are for general informational and educational purposes only. We do not claim any ownership over, nor do we intend to infringe upon, any trademarks, copyrights, logos, brand names, or other intellectual property mentioned or depicted on this site. Such intellectual property remains the property of its respective owners, and any references here are made solely for identification or informational purposes, without implying any affiliation, endorsement, or partnership.
We make no representations or warranties, express or implied, regarding the accuracy, completeness, or suitability of any content or products presented. Nothing on this website should be construed as legal, tax, investment, financial, medical, or other professional advice. In addition, no part of this site—including articles or product references—constitutes a solicitation, recommendation, endorsement, advertisement, or offer to buy or sell any securities, franchises, or other financial instruments, particularly in jurisdictions where such activity would be unlawful.
All content is of a general nature and may not address the specific circumstances of any individual or entity. It is not a substitute for professional advice or services. Any actions you take based on the information provided here are strictly at your own risk. You accept full responsibility for any decisions or outcomes arising from your use of this website and agree to release us from any liability in connection with your use of, or reliance upon, the content or products found herein.