
|
National Retail Properties ، Inc. (NNN) DCF تقييم |
Fully Editable: Tailor To Your Needs In Excel Or Sheets
Professional Design: Trusted, Industry-Standard Templates
Investor-Approved Valuation Models
MAC/PC Compatible, Fully Unlocked
No Expertise Is Needed; Easy To Follow
National Retail Properties, Inc. (NNN) Bundle
هل تتطلع إلى تحديد القيمة الجوهرية لخصائص البيع بالتجزئة الوطنية؟ يدمج حاسبة DCF (NNN) DCF بيانات العالم الحقيقي مع ميزات تخصيص واسعة ، مما يتيح لك تحسين توقعاتك وتعزيز اختيارات الاستثمار الخاصة بك.
What You Will Get
- Editable Forecast Inputs: Easily modify assumptions (growth %, margins, WACC) to explore various scenarios.
- Real-World Data: National Retail Properties, Inc. (NNN) financial data pre-loaded to kickstart your analysis.
- Automatic DCF Outputs: The template computes Net Present Value (NPV) and intrinsic value for you automatically.
- Customizable and Professional: A sleek Excel model that caters to your valuation requirements.
- Built for Analysts and Investors: Perfect for evaluating projections, validating strategies, and enhancing efficiency.
Key Features
- Accurate NNN Financials: Gain access to reliable pre-loaded historical data and future forecasts.
- Adjustable Forecast Parameters: Modify highlighted cells such as WACC, growth rates, and profit margins.
- Real-Time Calculations: Automatic updates for DCF, Net Present Value (NPV), and cash flow assessments.
- Interactive Dashboard: User-friendly charts and summaries to help visualize your valuation outcomes.
- Designed for All Skill Levels: A straightforward, intuitive layout tailored for investors, CFOs, and consultants alike.
How It Works
- Download the Template: Gain immediate access to the Excel-based NNN DCF Calculator.
- Input Your Assumptions: Modify the yellow-highlighted cells for growth rates, WACC, margins, and other variables.
- Instant Calculations: The model will automatically refresh to show National Retail Properties, Inc.'s intrinsic value.
- Test Scenarios: Experiment with various assumptions to assess potential changes in valuation.
- Analyze and Decide: Leverage the results to inform your investment or financial strategies.
Why Choose This Calculator for National Retail Properties, Inc. (NNN)?
- Precision: Utilizes actual financial data from National Retail Properties, Inc. for reliable calculations.
- Versatility: Built to allow users to easily adjust and experiment with various inputs.
- Efficiency: Eliminate the need to create a DCF model from the ground up.
- Expert-Level: Crafted with the accuracy and functionality expected by finance professionals.
- Intuitive: Simple to navigate, making it accessible for users without extensive financial modeling knowledge.
Who Should Use This Product?
- Investors: Evaluate National Retail Properties, Inc. (NNN)’s market position before making investment decisions.
- CFOs and Financial Analysts: Optimize valuation methodologies and assess financial forecasts.
- Real Estate Developers: Understand how established companies like National Retail Properties, Inc. (NNN) are appraised.
- Consultants: Create comprehensive valuation reports for clients in the retail sector.
- Students and Educators: Utilize current market data to learn and teach real estate valuation practices.
What the Template Contains
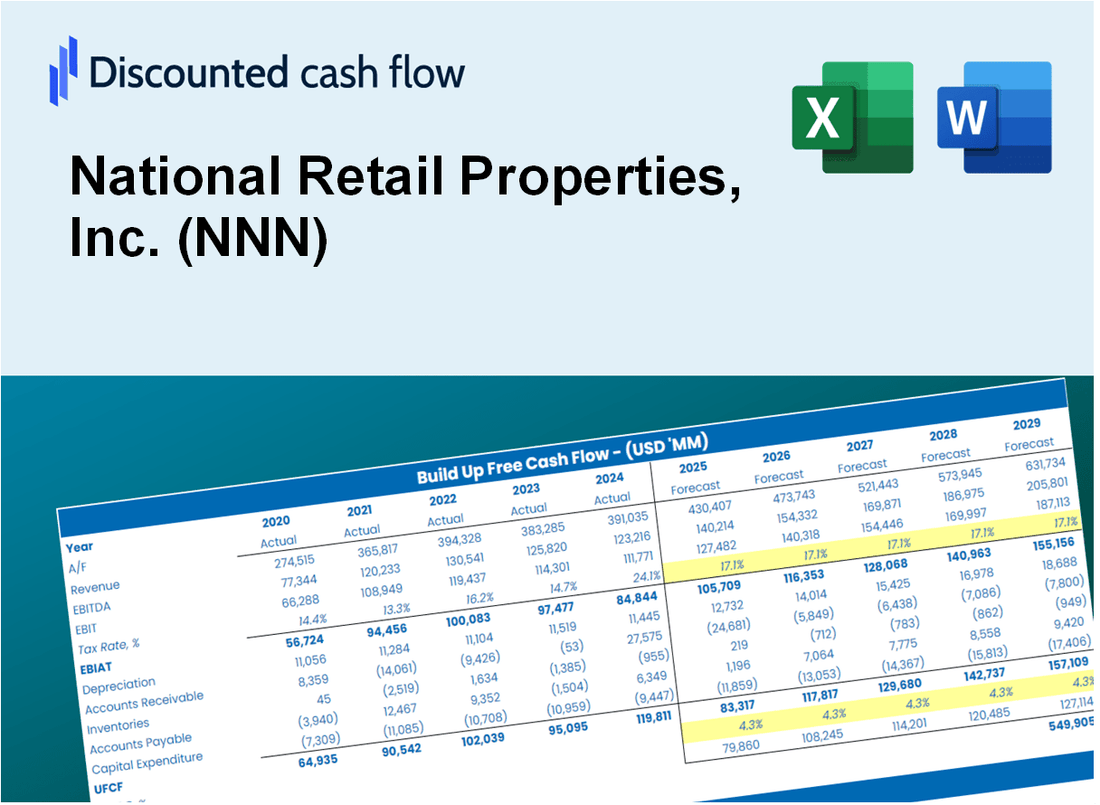
- Operating and Balance Sheet Data: Pre-filled National Retail Properties, Inc. (NNN) historical data and forecasts, including revenue, EBITDA, EBIT, and capital expenditures.
- WACC Calculation: A dedicated sheet for Weighted Average Cost of Capital (WACC), including parameters like Beta, risk-free rate, and share price.
- DCF Valuation (Unlevered and Levered): Editable Discounted Cash Flow models showing intrinsic value with detailed calculations.
- Financial Statements: Pre-loaded financial statements (annual and quarterly) to support analysis.
- Key Ratios: Includes profitability, leverage, and efficiency ratios for National Retail Properties, Inc. (NNN).
- Dashboard and Charts: Visual summary of valuation outputs and assumptions to analyze results easily.
Disclaimer
All information, articles, and product details provided on this website are for general informational and educational purposes only. We do not claim any ownership over, nor do we intend to infringe upon, any trademarks, copyrights, logos, brand names, or other intellectual property mentioned or depicted on this site. Such intellectual property remains the property of its respective owners, and any references here are made solely for identification or informational purposes, without implying any affiliation, endorsement, or partnership.
We make no representations or warranties, express or implied, regarding the accuracy, completeness, or suitability of any content or products presented. Nothing on this website should be construed as legal, tax, investment, financial, medical, or other professional advice. In addition, no part of this site—including articles or product references—constitutes a solicitation, recommendation, endorsement, advertisement, or offer to buy or sell any securities, franchises, or other financial instruments, particularly in jurisdictions where such activity would be unlawful.
All content is of a general nature and may not address the specific circumstances of any individual or entity. It is not a substitute for professional advice or services. Any actions you take based on the information provided here are strictly at your own risk. You accept full responsibility for any decisions or outcomes arising from your use of this website and agree to release us from any liability in connection with your use of, or reliance upon, the content or products found herein.