|
Northrop Grumman Corporation (NOC) تقييم DCF |
Fully Editable: Tailor To Your Needs In Excel Or Sheets
Professional Design: Trusted, Industry-Standard Templates
Investor-Approved Valuation Models
MAC/PC Compatible, Fully Unlocked
No Expertise Is Needed; Easy To Follow
Northrop Grumman Corporation (NOC) Bundle
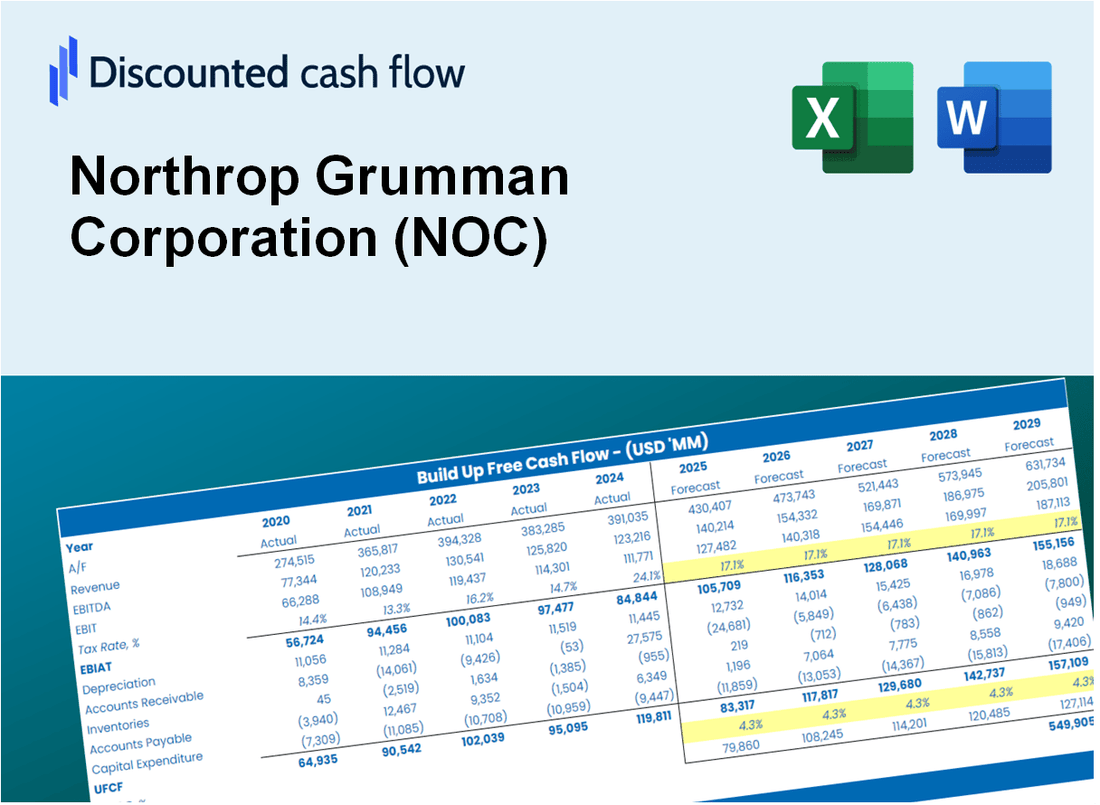
اكتشف القيمة الحقيقية لشركة Northrop Grumman Corporation (NOC) مع حاسبة DCF المتقدمة! اضبط الافتراضات الرئيسية واستكشاف السيناريوهات المختلفة وتقييم كيفية تأثير التغييرات على تقييم Northrop Grumman Corporation (NOC) - كل ذلك ضمن قالب Excel واحد مناسب.
What You Will Receive
- Customizable Excel Template: An adaptable Excel-based DCF Calculator featuring pre-filled financial data for Northrop Grumman Corporation (NOC).
- Accurate Data: Access to historical performance data and future projections (highlighted in the yellow cells).
- Adjustable Forecasts: Modify key assumptions such as revenue growth, EBITDA %, and WACC.
- Instant Calculations: Quickly observe how your inputs affect the valuation of Northrop Grumman Corporation (NOC).
- Professional Resource: Designed for use by investors, CFOs, consultants, and financial analysts.
- Intuitive Layout: Organized for straightforward navigation and usability, complete with detailed instructions.
Key Features
- 🔍 Real-Life NOC Financials: Pre-filled historical and projected data for Northrop Grumman Corporation (NOC).
- ✏️ Fully Customizable Inputs: Adjust all critical parameters (yellow cells) like WACC, growth %, and tax rates.
- 📊 Professional DCF Valuation: Built-in formulas calculate Northrop Grumman’s intrinsic value using the Discounted Cash Flow method.
- ⚡ Instant Results: Visualize Northrop Grumman’s valuation instantly after making changes.
- Scenario Analysis: Test and compare outcomes for various financial assumptions side-by-side.
How It Works
- Download the Template: Gain immediate access to the Excel-based NOC DCF Calculator.
- Input Your Assumptions: Modify the yellow-highlighted cells for growth rates, WACC, margins, and other key factors.
- Instant Calculations: The model automatically recalculates Northrop Grumman’s intrinsic value.
- Test Scenarios: Experiment with various assumptions to see how they impact valuation outcomes.
- Analyze and Decide: Utilize the results to inform your investment or financial strategies.
Why Choose This Calculator for Northrop Grumman Corporation (NOC)?
- User-Friendly Interface: Ideal for both novices and seasoned professionals.
- Customizable Inputs: Adjust parameters easily to suit your financial analysis.
- Real-Time Valuation: Observe immediate updates to Northrop Grumman’s valuation with input changes.
- Preloaded Data: Comes equipped with Northrop Grumman’s latest financial information for efficient evaluation.
- Relied Upon by Experts: A go-to tool for investors and analysts seeking to make well-informed choices.
Who Should Use This Product?
- Investors: Accurately assess Northrop Grumman’s fair value before making investment decisions.
- CFOs: Utilize a professional-grade DCF model for financial reporting and analysis related to Northrop Grumman (NOC).
- Consultants: Easily modify the template for valuation reports tailored to Northrop Grumman (NOC) clients.
- Entrepreneurs: Discover insights into financial modeling practices employed by leading defense contractors.
- Educators: Implement it as a teaching resource to illustrate valuation methodologies specific to the aerospace and defense sector.
What the Template Contains
- Pre-Filled Data: Includes Northrop Grumman's historical financials and forecasts.
- Discounted Cash Flow Model: Editable DCF valuation model with automatic calculations.
- Weighted Average Cost of Capital (WACC): A dedicated sheet for calculating WACC based on custom inputs.
- Key Financial Ratios: Analyze Northrop Grumman's profitability, efficiency, and leverage.
- Customizable Inputs: Edit revenue growth, margins, and tax rates with ease.
- Clear Dashboard: Charts and tables summarizing key valuation results.
Disclaimer
All information, articles, and product details provided on this website are for general informational and educational purposes only. We do not claim any ownership over, nor do we intend to infringe upon, any trademarks, copyrights, logos, brand names, or other intellectual property mentioned or depicted on this site. Such intellectual property remains the property of its respective owners, and any references here are made solely for identification or informational purposes, without implying any affiliation, endorsement, or partnership.
We make no representations or warranties, express or implied, regarding the accuracy, completeness, or suitability of any content or products presented. Nothing on this website should be construed as legal, tax, investment, financial, medical, or other professional advice. In addition, no part of this site—including articles or product references—constitutes a solicitation, recommendation, endorsement, advertisement, or offer to buy or sell any securities, franchises, or other financial instruments, particularly in jurisdictions where such activity would be unlawful.
All content is of a general nature and may not address the specific circumstances of any individual or entity. It is not a substitute for professional advice or services. Any actions you take based on the information provided here are strictly at your own risk. You accept full responsibility for any decisions or outcomes arising from your use of this website and agree to release us from any liability in connection with your use of, or reliance upon, the content or products found herein.