
|
Enpro Industries ، Inc. (NPO) تقييم DCF |
Fully Editable: Tailor To Your Needs In Excel Or Sheets
Professional Design: Trusted, Industry-Standard Templates
Investor-Approved Valuation Models
MAC/PC Compatible, Fully Unlocked
No Expertise Is Needed; Easy To Follow
EnPro Industries, Inc. (NPO) Bundle
اكتساب نظرة ثاقبة على تحليل تقييم Enpro Industries ، Inc. (NPO) باستخدام حاسبة DCF المتطورة! يتيح لك هذا القالب Excel مزودًا ببيانات حقيقية (NPO) لضبط التوقعات والافتراضات لتحديد القيمة الجوهرية لشركة Enpro Industries ، Inc.
What You Will Get
- Editable Forecast Inputs: Easily modify assumptions (growth %, margins, WACC) to explore various scenarios.
- Real-World Data: EnPro Industries, Inc. (NPO)’s financial data pre-filled to accelerate your analysis.
- Automatic DCF Outputs: The template computes Net Present Value (NPV) and intrinsic value automatically.
- Customizable and Professional: A sleek Excel model that adjusts to your valuation requirements.
- Built for Analysts and Investors: Perfect for evaluating projections, validating strategies, and enhancing efficiency.
Key Features
- Accurate EnPro Financials: Gain access to precise pre-loaded historical data and future forecasts.
- Adjustable Forecast Assumptions: Modify highlighted cells for WACC, growth rates, and profit margins.
- Real-Time Calculations: Automatic updates for DCF, Net Present Value (NPV), and cash flow assessments.
- Interactive Dashboard: Intuitive charts and summaries to help visualize your valuation outcomes.
- Suitable for All Skill Levels: A user-friendly layout designed for investors, CFOs, and consultants alike.
How It Works
- Step 1: Download the Excel file.
- Step 2: Review pre-entered EnPro Industries data (historical and projected).
- Step 3: Adjust key assumptions (yellow cells) based on your analysis.
- Step 4: View automatic recalculations for EnPro Industries’ intrinsic value.
- Step 5: Use the outputs for investment decisions or reporting.
Why Choose This Calculator for EnPro Industries, Inc. (NPO)?
- User-Friendly Interface: Perfect for both novices and seasoned professionals.
- Customizable Inputs: Easily adjust parameters to suit your financial analysis.
- Real-Time Feedback: Observe immediate updates to EnPro’s valuation as you modify inputs.
- Preloaded Data: Comes with EnPro’s actual financial figures for swift evaluations.
- Relied Upon by Experts: Favored by analysts and investors for making strategic choices.
Who Should Use This Product?
- Investors: Accurately estimate EnPro Industries' fair value before making investment decisions.
- CFOs: Utilize a professional-grade DCF model for financial reporting and analysis specific to EnPro Industries (NPO).
- Consultants: Quickly adapt the template for valuation reports tailored to EnPro Industries (NPO) clients.
- Entrepreneurs: Gain insights into financial modeling practices employed by leading companies like EnPro Industries (NPO).
- Educators: Use it as a teaching tool to illustrate valuation methodologies applicable to EnPro Industries (NPO).
What the Template Contains
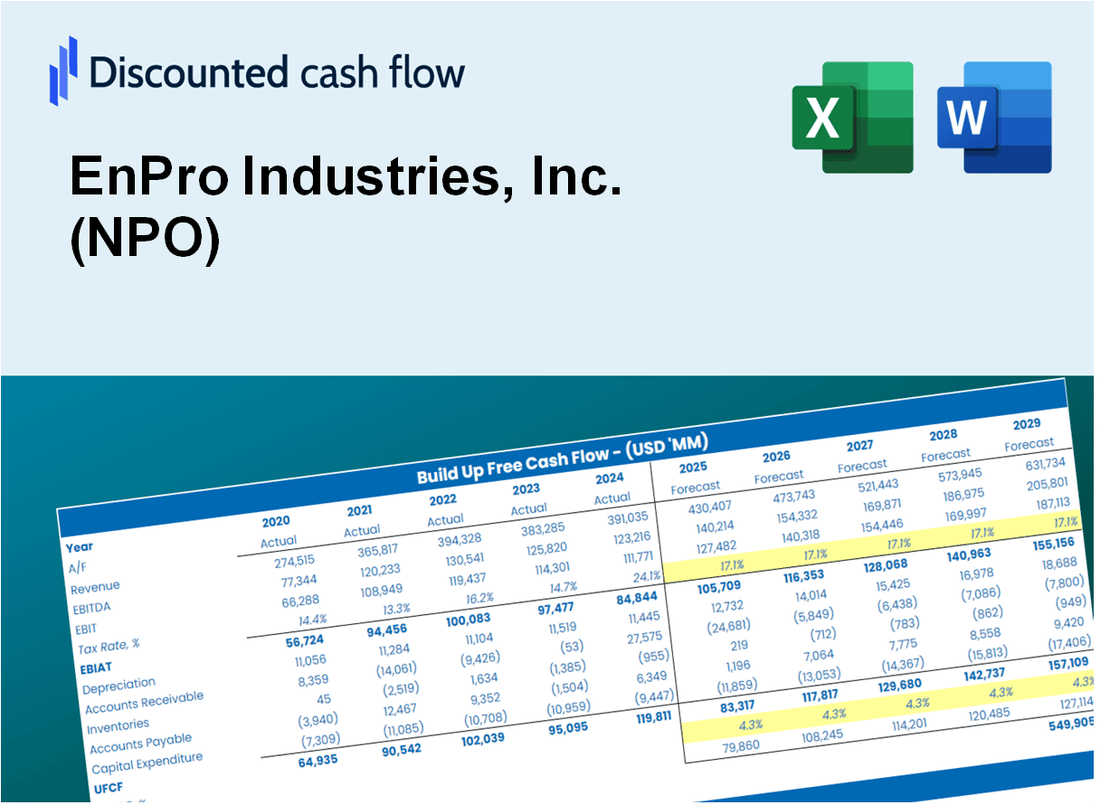
- Operating and Balance Sheet Data: Pre-filled EnPro Industries historical data and forecasts, including revenue, EBITDA, EBIT, and capital expenditures.
- WACC Calculation: A dedicated sheet for Weighted Average Cost of Capital (WACC), including parameters like Beta, risk-free rate, and share price.
- DCF Valuation (Unlevered and Levered): Editable Discounted Cash Flow models showing intrinsic value with detailed calculations.
- Financial Statements: Pre-loaded financial statements (annual and quarterly) to support analysis.
- Key Ratios: Includes profitability, leverage, and efficiency ratios for EnPro Industries, Inc. (NPO).
- Dashboard and Charts: Visual summary of valuation outputs and assumptions to analyze results easily.
Disclaimer
All information, articles, and product details provided on this website are for general informational and educational purposes only. We do not claim any ownership over, nor do we intend to infringe upon, any trademarks, copyrights, logos, brand names, or other intellectual property mentioned or depicted on this site. Such intellectual property remains the property of its respective owners, and any references here are made solely for identification or informational purposes, without implying any affiliation, endorsement, or partnership.
We make no representations or warranties, express or implied, regarding the accuracy, completeness, or suitability of any content or products presented. Nothing on this website should be construed as legal, tax, investment, financial, medical, or other professional advice. In addition, no part of this site—including articles or product references—constitutes a solicitation, recommendation, endorsement, advertisement, or offer to buy or sell any securities, franchises, or other financial instruments, particularly in jurisdictions where such activity would be unlawful.
All content is of a general nature and may not address the specific circumstances of any individual or entity. It is not a substitute for professional advice or services. Any actions you take based on the information provided here are strictly at your own risk. You accept full responsibility for any decisions or outcomes arising from your use of this website and agree to release us from any liability in connection with your use of, or reliance upon, the content or products found herein.