
|
Nurix Therapeutics ، Inc. (NRIX) DCF تقييم |
Fully Editable: Tailor To Your Needs In Excel Or Sheets
Professional Design: Trusted, Industry-Standard Templates
Investor-Approved Valuation Models
MAC/PC Compatible, Fully Unlocked
No Expertise Is Needed; Easy To Follow
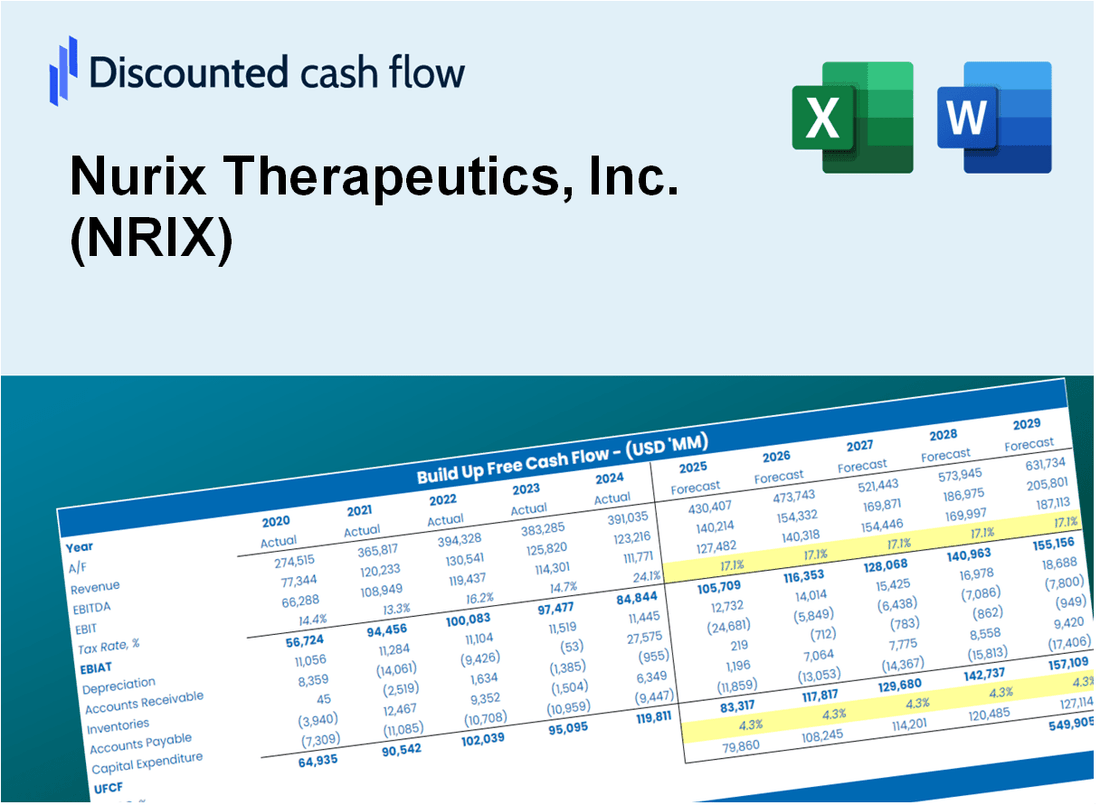
Nurix Therapeutics, Inc. (NRIX) Bundle
تبسيط التقييم Nurix Therapeutics ، Inc. (NRIX) مع هذه الآلة الحاسبة DCF القابلة للتخصيص! يضم Real Nurix Therapeutics ، Inc. (NRIX) ومدخلات التنبؤ القابلة للتعديل ، يمكنك اختبار السيناريوهات وكشف القيمة العادلة Nurix Therapeutics ، Inc. (NRIX) في دقائق.
Discounted Cash Flow (DCF) - (USD MM)
| Year | AY1 2020 |
AY2 2021 |
AY3 2022 |
AY4 2023 |
AY5 2024 |
FY1 2025 |
FY2 2026 |
FY3 2027 |
FY4 2028 |
FY5 2029 |
|---|---|---|---|---|---|---|---|---|---|---|
| Revenue | 17.8 | 29.8 | 38.6 | 77.0 | 54.5 | 77.3 | 109.6 | 155.3 | 220.2 | 312.0 |
| Revenue Growth, % | 0 | 66.95 | 29.84 | 99.31 | -29.15 | 41.74 | 41.74 | 41.74 | 41.74 | 41.74 |
| EBITDA | -62.8 | -115.9 | -179.7 | -148.9 | -205.0 | -77.3 | -109.6 | -155.3 | -220.2 | -312.0 |
| EBITDA, % | -352.43 | -389.57 | -465.27 | -193.45 | -375.83 | -100 | -100 | -100 | -100 | -100 |
| Depreciation | 2.2 | 2.0 | 4.1 | 6.1 | 8.0 | 8.1 | 11.5 | 16.3 | 23.0 | 32.7 |
| Depreciation, % | 12.23 | 6.69 | 10.74 | 7.97 | 14.7 | 10.47 | 10.47 | 10.47 | 10.47 | 10.47 |
| EBIT | -65.0 | -117.9 | -183.9 | -155.1 | -213.0 | -77.3 | -109.6 | -155.3 | -220.2 | -312.0 |
| EBIT, % | -364.66 | -396.26 | -476.01 | -201.41 | -390.52 | -100 | -100 | -100 | -100 | -100 |
| Total Cash | 281.1 | 295.7 | 309.1 | 287.9 | 609.6 | 77.3 | 109.6 | 155.3 | 220.2 | 312.0 |
| Total Cash, percent | .0 | .0 | .0 | .0 | .0 | .0 | .0 | .0 | .0 | .0 |
| Account Receivables | 11.3 | 6.2 | 1.1 | .8 | 1.5 | 14.1 | 20.0 | 28.3 | 40.1 | 56.9 |
| Account Receivables, % | 63.67 | 20.85 | 2.85 | 1.04 | 2.75 | 18.23 | 18.23 | 18.23 | 18.23 | 18.23 |
| Inventories | .0 | .0 | -1.1 | .0 | .0 | -.4 | -.6 | -.9 | -1.3 | -1.8 |
| Inventories, % | 0 | 0 | -2.85 | 0 | 0 | -0.56955 | -0.56955 | -0.56955 | -0.56955 | -0.56955 |
| Accounts Payable | 3.4 | 6.7 | 5.1 | 6.4 | 11.5 | 13.0 | 18.4 | 26.1 | 37.0 | 52.4 |
| Accounts Payable, % | 19.15 | 22.35 | 13.11 | 8.31 | 21.05 | 16.79 | 16.79 | 16.79 | 16.79 | 16.79 |
| Capital Expenditure | -4.6 | -5.7 | -12.2 | -8.4 | -9.3 | -16.1 | -22.8 | -32.4 | -45.9 | -65.0 |
| Capital Expenditure, % | -25.55 | -19.03 | -31.7 | -10.91 | -17 | -20.84 | -20.84 | -20.84 | -20.84 | -20.84 |
| Tax Rate, % | -0.13968 | -0.13968 | -0.13968 | -0.13968 | -0.13968 | -0.13968 | -0.13968 | -0.13968 | -0.13968 | -0.13968 |
| EBITAT | -44.1 | -118.0 | -183.9 | -155.1 | -213.3 | -72.3 | -102.5 | -145.3 | -206.0 | -291.9 |
| Depreciation | ||||||||||
| Changes in Account Receivables | ||||||||||
| Changes in Inventories | ||||||||||
| Changes in Accounts Payable | ||||||||||
| Capital Expenditure | ||||||||||
| UFCF | -54.4 | -113.3 | -187.3 | -156.8 | -210.2 | -91.0 | -114.2 | -161.8 | -229.4 | -325.1 |
| WACC, % | 12.45 | 12.49 | 12.49 | 12.49 | 12.49 | 12.48 | 12.48 | 12.48 | 12.48 | 12.48 |
| PV UFCF | ||||||||||
| SUM PV UFCF | -608.8 | |||||||||
| Long Term Growth Rate, % | 2.00 | |||||||||
| Free cash flow (T + 1) | -332 | |||||||||
| Terminal Value | -3,165 | |||||||||
| Present Terminal Value | -1,758 | |||||||||
| Enterprise Value | -2,367 | |||||||||
| Net Debt | -82 | |||||||||
| Equity Value | -2,285 | |||||||||
| Diluted Shares Outstanding, MM | 67 | |||||||||
| Equity Value Per Share | -34.04 |
What You Will Get
- Comprehensive NRIX Financials: Access to both historical and projected data for precise valuation.
- Customizable Inputs: Adjust WACC, tax rates, revenue growth, and capital expenditures as needed.
- Dynamic Calculations: Intrinsic value and NPV are computed automatically.
- Scenario Analysis: Evaluate various scenarios to assess Nurix Therapeutics' future performance.
- User-Friendly Interface: Designed for experts while remaining approachable for newcomers.
Key Features
- Comprehensive Financial Data: Access precise pre-loaded historical performance and future forecasts for Nurix Therapeutics, Inc. (NRIX).
- Adjustable Projection Parameters: Modify highlighted cells for key metrics such as WACC, growth rates, and profit margins.
- Real-Time Calculations: Instant updates to DCF, Net Present Value (NPV), and cash flow assessments.
- Interactive Visualization Tools: User-friendly charts and summaries to illustrate your valuation findings.
- Designed for All Levels: An intuitive layout suitable for investors, CFOs, and consultants alike.
How It Works
- Download the Template: Gain immediate access to the Excel-based NRIX DCF Calculator.
- Input Your Assumptions: Modify the yellow-highlighted cells for growth rates, WACC, margins, and more.
- Instant Calculations: The model automatically recalculates Nurix Therapeutics’ intrinsic value.
- Test Scenarios: Experiment with various assumptions to assess potential valuation changes.
- Analyze and Decide: Utilize the results to inform your investment or financial analysis.
Why Choose This Calculator for Nurix Therapeutics, Inc. (NRIX)?
- Accurate Data: Utilize real Nurix Therapeutics financials for trustworthy valuation outcomes.
- Customizable: Tailor essential parameters such as growth rates, WACC, and tax rates to align with your forecasts.
- Time-Saving: Pre-configured calculations streamline the process, saving you from starting from scratch.
- Professional-Grade Tool: Crafted for investors, analysts, and consultants in the biotech sector.
- User-Friendly: Featuring an intuitive design and clear step-by-step guidance for users of all experience levels.
Who Should Use This Product?
- Biotech Students: Understand drug development processes and apply them using real-world examples.
- Researchers: Integrate advanced therapeutic models into studies or publications.
- Investors: Evaluate your own hypotheses and assess valuation scenarios for Nurix Therapeutics, Inc. (NRIX).
- Analysts: Enhance your analysis with a comprehensive, customizable financial model.
- Pharmaceutical Entrepreneurs: Discover how major biotech firms like Nurix Therapeutics are evaluated.
What the Template Contains
- Operating and Balance Sheet Data: Pre-filled Nurix Therapeutics historical data and forecasts, including revenue, EBITDA, EBIT, and capital expenditures.
- WACC Calculation: A dedicated sheet for Weighted Average Cost of Capital (WACC), including parameters like Beta, risk-free rate, and share price.
- DCF Valuation (Unlevered and Levered): Editable Discounted Cash Flow models showing intrinsic value with detailed calculations.
- Financial Statements: Pre-loaded financial statements (annual and quarterly) to support analysis.
- Key Ratios: Includes profitability, leverage, and efficiency ratios for Nurix Therapeutics, Inc. (NRIX).
- Dashboard and Charts: Visual summary of valuation outputs and assumptions to analyze results easily.
Disclaimer
All information, articles, and product details provided on this website are for general informational and educational purposes only. We do not claim any ownership over, nor do we intend to infringe upon, any trademarks, copyrights, logos, brand names, or other intellectual property mentioned or depicted on this site. Such intellectual property remains the property of its respective owners, and any references here are made solely for identification or informational purposes, without implying any affiliation, endorsement, or partnership.
We make no representations or warranties, express or implied, regarding the accuracy, completeness, or suitability of any content or products presented. Nothing on this website should be construed as legal, tax, investment, financial, medical, or other professional advice. In addition, no part of this site—including articles or product references—constitutes a solicitation, recommendation, endorsement, advertisement, or offer to buy or sell any securities, franchises, or other financial instruments, particularly in jurisdictions where such activity would be unlawful.
All content is of a general nature and may not address the specific circumstances of any individual or entity. It is not a substitute for professional advice or services. Any actions you take based on the information provided here are strictly at your own risk. You accept full responsibility for any decisions or outcomes arising from your use of this website and agree to release us from any liability in connection with your use of, or reliance upon, the content or products found herein.