
|
بنك N.T. butterfield & Son Limited (NTB) تقييم DCF |
Fully Editable: Tailor To Your Needs In Excel Or Sheets
Professional Design: Trusted, Industry-Standard Templates
Investor-Approved Valuation Models
MAC/PC Compatible, Fully Unlocked
No Expertise Is Needed; Easy To Follow
The Bank of N.T. Butterfield & Son Limited (NTB) Bundle
استكشاف الآفاق المالية لبنك N.T. butterfield & Son Limited (NTB) مع حاسبة DCF سهلة الاستخدام! أدخل افتراضاتك المتعلقة بالنمو والهوامش والتكاليف لحساب القيمة الجوهرية لـ (NTB) وتحسين استراتيجيتك الاستثمارية.
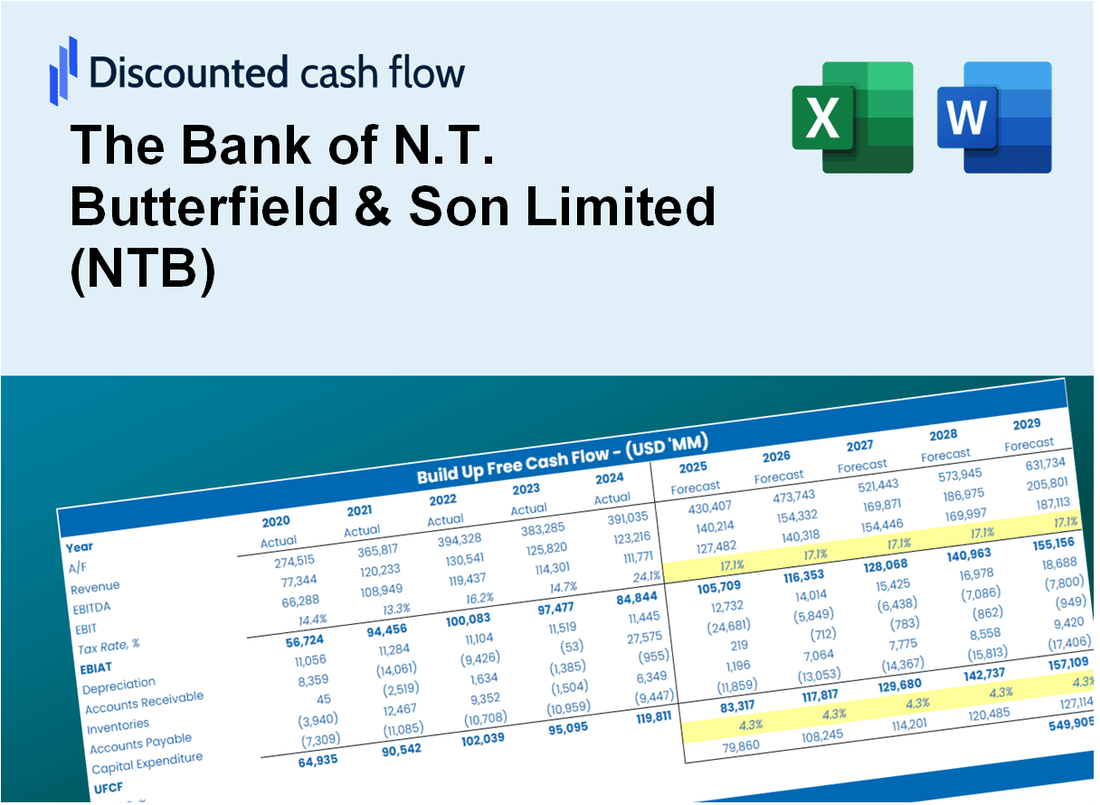
Discounted Cash Flow (DCF) - (USD MM)
| Year | AY1 2020 |
AY2 2021 |
AY3 2022 |
AY4 2023 |
AY5 2024 |
FY1 2025 |
FY2 2026 |
FY3 2027 |
FY4 2028 |
FY5 2029 |
|---|---|---|---|---|---|---|---|---|---|---|
| Revenue | 502.7 | 496.5 | 551.7 | 578.6 | 581.6 | 603.8 | 626.9 | 650.8 | 675.7 | 701.5 |
| Revenue Growth, % | 0 | -1.23 | 11.12 | 4.88 | 0.51901 | 3.82 | 3.82 | 3.82 | 3.82 | 3.82 |
| EBITDA | .0 | 235.2 | 257.9 | 262.5 | 220.8 | 214.3 | 222.5 | 231.0 | 239.8 | 249.0 |
| EBITDA, % | 0 | 47.38 | 46.74 | 45.36 | 37.96 | 35.49 | 35.49 | 35.49 | 35.49 | 35.49 |
| Depreciation | 62.4 | 69.5 | 40.2 | 36.2 | .0 | 48.2 | 50.1 | 52.0 | 54.0 | 56.0 |
| Depreciation, % | 12.42 | 13.99 | 7.28 | 6.26 | 0 | 7.99 | 7.99 | 7.99 | 7.99 | 7.99 |
| EBIT | -62.4 | 165.8 | 217.7 | 226.3 | 220.8 | 166.1 | 172.4 | 179.0 | 185.8 | 192.9 |
| EBIT, % | -12.42 | 33.39 | 39.46 | 39.1 | 37.96 | 27.5 | 27.5 | 27.5 | 27.5 | 27.5 |
| Total Cash | 4,113.0 | 3,379.0 | 2,985.0 | 2,285.8 | 4,666.7 | 603.8 | 626.9 | 650.8 | 675.7 | 701.5 |
| Total Cash, percent | .0 | .0 | .0 | .0 | .0 | .0 | .0 | .0 | .0 | .0 |
| Account Receivables | 144.8 | 144.3 | 203.5 | .0 | .0 | 114.4 | 118.8 | 123.3 | 128.0 | 132.9 |
| Account Receivables, % | 28.8 | 29.06 | 36.89 | 0 | 0 | 18.95 | 18.95 | 18.95 | 18.95 | 18.95 |
| Inventories | -4,329.7 | -3,483.4 | -3,062.8 | .0 | .0 | -362.3 | -376.1 | -390.5 | -405.4 | -420.9 |
| Inventories, % | -861.3 | -701.59 | -555.15 | 0 | 0 | -60 | -60 | -60 | -60 | -60 |
| Accounts Payable | 203.9 | 189.4 | 185.9 | .0 | .0 | 135.7 | 140.9 | 146.3 | 151.9 | 157.7 |
| Accounts Payable, % | 40.55 | 38.14 | 33.69 | 0 | 0 | 22.48 | 22.48 | 22.48 | 22.48 | 22.48 |
| Capital Expenditure | -20.6 | -15.7 | -26.9 | -54.3 | -21.5 | -30.4 | -31.6 | -32.8 | -34.1 | -35.4 |
| Capital Expenditure, % | -4.09 | -3.17 | -4.87 | -9.38 | -3.7 | -5.04 | -5.04 | -5.04 | -5.04 | -5.04 |
| Tax Rate, % | 2.04 | 2.04 | 2.04 | 2.04 | 2.04 | 2.04 | 2.04 | 2.04 | 2.04 | 2.04 |
| EBITAT | -61.4 | 162.7 | 214.0 | 225.5 | 216.3 | 163.5 | 169.8 | 176.3 | 183.0 | 190.0 |
| Depreciation | ||||||||||
| Changes in Account Receivables | ||||||||||
| Changes in Inventories | ||||||||||
| Changes in Accounts Payable | ||||||||||
| Capital Expenditure | ||||||||||
| UFCF | 4,369.2 | -643.9 | -256.0 | -2,837.7 | 194.8 | 564.9 | 202.9 | 210.7 | 218.7 | 227.1 |
| WACC, % | 6.36 | 6.36 | 6.36 | 6.36 | 6.36 | 6.36 | 6.36 | 6.36 | 6.36 | 6.36 |
| PV UFCF | ||||||||||
| SUM PV UFCF | 1,223.3 | |||||||||
| Long Term Growth Rate, % | 2.00 | |||||||||
| Free cash flow (T + 1) | 232 | |||||||||
| Terminal Value | 5,311 | |||||||||
| Present Terminal Value | 3,902 | |||||||||
| Enterprise Value | 5,125 | |||||||||
| Net Debt | -1,899 | |||||||||
| Equity Value | 7,025 | |||||||||
| Diluted Shares Outstanding, MM | 45 | |||||||||
| Equity Value Per Share | 155.89 |
What You Will Get
- Editable Excel Template: A fully customizable Excel-based DCF Calculator featuring pre-filled real NTB financials.
- Real-World Data: Historical data and forward-looking estimates (as indicated in the yellow cells).
- Forecast Flexibility: Adjust forecast assumptions such as revenue growth, EBITDA %, and WACC.
- Automatic Calculations: Instantly observe how your inputs affect the valuation of The Bank of N.T. Butterfield & Son Limited (NTB).
- Professional Tool: Designed for investors, CFOs, consultants, and financial analysts.
- User-Friendly Design: Organized for clarity and ease of use, complete with step-by-step instructions.
Key Features
- Comprehensive Financial Data: Access to The Bank of N.T. Butterfield & Son Limited's historical financial statements and pre-filled projections.
- Customizable Parameters: Adjust WACC, tax rates, revenue growth, and net interest margins to fit your analysis.
- Real-Time Valuation: Instantly view The Bank of N.T. Butterfield & Son Limited's intrinsic value as it updates live.
- Intuitive Visualizations: User-friendly dashboard charts illustrate valuation outcomes and essential metrics.
- Precision Designed: A reliable tool tailored for analysts, investors, and finance professionals.
How It Works
- Download: Obtain the pre-configured Excel file featuring The Bank of N.T. Butterfield & Son Limited’s (NTB) financial metrics.
- Customize: Modify projections such as interest income growth, net interest margin, and cost of equity.
- Update Automatically: The intrinsic value and NPV calculations refresh in real-time.
- Test Scenarios: Develop various forecasts and instantly evaluate different outcomes.
- Make Decisions: Leverage the valuation insights to inform your investment approach.
Why Choose This Calculator for The Bank of N.T. Butterfield & Son Limited (NTB)?
- Accurate Data: Utilize real financial data from The Bank of N.T. Butterfield & Son Limited for dependable valuation outcomes.
- Customizable: Modify essential parameters such as growth rates, WACC, and tax rates to align with your forecasts.
- Time-Saving: Pre-configured calculations streamline the process, allowing you to avoid starting from scratch.
- Professional-Grade Tool: Tailored for investors, analysts, and financial consultants.
- User-Friendly: With an intuitive design and clear step-by-step guidance, it's accessible for all users.
Who Should Use This Product?
- Investors: Accurately assess the fair value of The Bank of N.T. Butterfield & Son Limited (NTB) before making investment choices.
- CFOs: Utilize a top-tier DCF model for comprehensive financial reporting and analysis.
- Consultants: Efficiently customize the template for valuation reports tailored to clients.
- Entrepreneurs: Acquire insights into the financial modeling practices of leading financial institutions.
- Educators: Employ it as a teaching resource to illustrate valuation techniques.
What the Template Contains
- Preloaded NTB Data: Historical and projected financial data, including revenue, EBIT, and capital expenditures.
- DCF and WACC Models: Professional-grade sheets for calculating intrinsic value and Weighted Average Cost of Capital.
- Editable Inputs: Yellow-highlighted cells for adjusting revenue growth, tax rates, and discount rates.
- Financial Statements: Comprehensive annual and quarterly financials for deeper analysis.
- Key Ratios: Profitability, leverage, and efficiency ratios to evaluate performance.
- Dashboard and Charts: Visual summaries of valuation outcomes and assumptions.
Disclaimer
All information, articles, and product details provided on this website are for general informational and educational purposes only. We do not claim any ownership over, nor do we intend to infringe upon, any trademarks, copyrights, logos, brand names, or other intellectual property mentioned or depicted on this site. Such intellectual property remains the property of its respective owners, and any references here are made solely for identification or informational purposes, without implying any affiliation, endorsement, or partnership.
We make no representations or warranties, express or implied, regarding the accuracy, completeness, or suitability of any content or products presented. Nothing on this website should be construed as legal, tax, investment, financial, medical, or other professional advice. In addition, no part of this site—including articles or product references—constitutes a solicitation, recommendation, endorsement, advertisement, or offer to buy or sell any securities, franchises, or other financial instruments, particularly in jurisdictions where such activity would be unlawful.
All content is of a general nature and may not address the specific circumstances of any individual or entity. It is not a substitute for professional advice or services. Any actions you take based on the information provided here are strictly at your own risk. You accept full responsibility for any decisions or outcomes arising from your use of this website and agree to release us from any liability in connection with your use of, or reliance upon, the content or products found herein.