
|
تقييم Novocure Limited (NVCR) DCF |
Fully Editable: Tailor To Your Needs In Excel Or Sheets
Professional Design: Trusted, Industry-Standard Templates
Investor-Approved Valuation Models
MAC/PC Compatible, Fully Unlocked
No Expertise Is Needed; Easy To Follow
NovoCure Limited (NVCR) Bundle
اكتساب رؤى في تحليل تقييم Novocure Limited (NVCR) باستخدام حاسبة DCF المتطورة! يأتي قالب Excel هذا مسبقًا مع بيانات NVCR الفعلية ، مما يتيح لك ضبط التوقعات والافتراضات لتحديد القيمة الجوهرية لـ Novocure Limited بدقة.
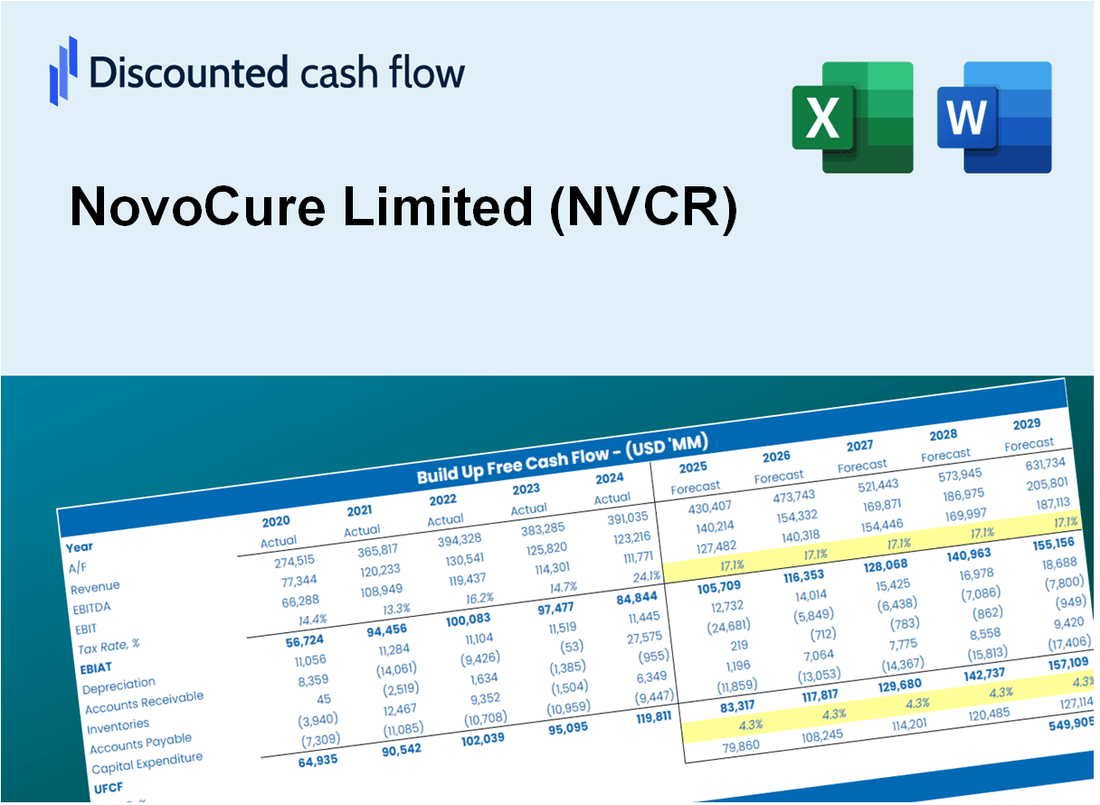
Discounted Cash Flow (DCF) - (USD MM)
| Year | AY1 2020 |
AY2 2021 |
AY3 2022 |
AY4 2023 |
AY5 2024 |
FY1 2025 |
FY2 2026 |
FY3 2027 |
FY4 2028 |
FY5 2029 |
|---|---|---|---|---|---|---|---|---|---|---|
| Revenue | 494.4 | 535.0 | 537.8 | 509.3 | 605.2 | 638.9 | 674.5 | 712.1 | 751.7 | 793.6 |
| Revenue Growth, % | 0 | 8.23 | 0.52502 | -5.3 | 18.82 | 5.57 | 5.57 | 5.57 | 5.57 | 5.57 |
| EBITDA | 45.3 | -38.4 | -67.9 | -177.5 | -108.3 | -81.0 | -85.5 | -90.2 | -95.3 | -100.6 |
| EBITDA, % | 9.16 | -7.17 | -12.62 | -34.84 | -17.89 | -12.67 | -12.67 | -12.67 | -12.67 | -12.67 |
| Depreciation | 9.2 | 10.3 | 10.6 | 11.0 | 11.2 | 12.5 | 13.2 | 13.9 | 14.7 | 15.5 |
| Depreciation, % | 1.85 | 1.92 | 1.98 | 2.15 | 1.86 | 1.95 | 1.95 | 1.95 | 1.95 | 1.95 |
| EBIT | 36.2 | -48.6 | -78.5 | -188.4 | -119.5 | -93.4 | -98.6 | -104.1 | -109.9 | -116.0 |
| EBIT, % | 7.31 | -9.09 | -14.6 | -36.99 | -19.74 | -14.62 | -14.62 | -14.62 | -14.62 | -14.62 |
| Total Cash | 842.6 | 937.7 | 969.4 | 910.6 | 959.9 | 638.9 | 674.5 | 712.1 | 751.7 | 793.6 |
| Total Cash, percent | .0 | .0 | .0 | .0 | .0 | .0 | .0 | .0 | .0 | .0 |
| Account Receivables | 96.7 | 93.6 | 86.3 | 77.1 | 102.1 | 108.7 | 114.8 | 121.2 | 127.9 | 135.1 |
| Account Receivables, % | 19.56 | 17.49 | 16.04 | 15.14 | 16.87 | 17.02 | 17.02 | 17.02 | 17.02 | 17.02 |
| Inventories | 27.4 | 24.4 | 29.4 | 38.2 | 35.1 | 36.9 | 38.9 | 41.1 | 43.4 | 45.8 |
| Inventories, % | 5.55 | 4.57 | 5.46 | 7.49 | 5.8 | 5.77 | 5.77 | 5.77 | 5.77 | 5.77 |
| Accounts Payable | 53.6 | 72.6 | 85.2 | 94.4 | 105.1 | 97.3 | 102.7 | 108.5 | 114.5 | 120.9 |
| Accounts Payable, % | 10.85 | 13.57 | 15.84 | 18.53 | 17.36 | 15.23 | 15.23 | 15.23 | 15.23 | 15.23 |
| Capital Expenditure | -15.0 | -24.2 | -21.4 | -27.1 | -42.9 | -30.6 | -32.3 | -34.1 | -36.0 | -38.0 |
| Capital Expenditure, % | -3.03 | -4.52 | -3.97 | -5.32 | -7.08 | -4.78 | -4.78 | -4.78 | -4.78 | -4.78 |
| Tax Rate, % | -28.56 | -28.56 | -28.56 | -28.56 | -28.56 | -28.56 | -28.56 | -28.56 | -28.56 | -28.56 |
| EBITAT | 39.6 | -54.5 | -88.8 | -203.5 | -153.6 | -93.4 | -98.6 | -104.1 | -109.9 | -116.0 |
| Depreciation | ||||||||||
| Changes in Account Receivables | ||||||||||
| Changes in Inventories | ||||||||||
| Changes in Accounts Payable | ||||||||||
| Capital Expenditure | ||||||||||
| UFCF | -36.7 | -43.3 | -84.5 | -210.0 | -196.4 | -127.8 | -120.4 | -127.1 | -134.2 | -141.7 |
| WACC, % | 6.24 | 6.24 | 6.24 | 6.24 | 6.24 | 6.24 | 6.24 | 6.24 | 6.24 | 6.24 |
| PV UFCF | ||||||||||
| SUM PV UFCF | -543.0 | |||||||||
| Long Term Growth Rate, % | 2.00 | |||||||||
| Free cash flow (T + 1) | -145 | |||||||||
| Terminal Value | -3,409 | |||||||||
| Present Terminal Value | -2,519 | |||||||||
| Enterprise Value | -3,062 | |||||||||
| Net Debt | 520 | |||||||||
| Equity Value | -3,581 | |||||||||
| Diluted Shares Outstanding, MM | 108 | |||||||||
| Equity Value Per Share | -33.21 |
What You Will Get
- Editable Forecast Inputs: Easily modify assumptions (growth %, margins, WACC) to explore various scenarios.
- Real-World Data: NovoCure’s financial data pre-loaded to kickstart your analysis.
- Automatic DCF Outputs: The template computes Net Present Value (NPV) and intrinsic value automatically.
- Customizable and Professional: A refined Excel model that adjusts to your valuation requirements.
- Built for Analysts and Investors: Perfect for evaluating projections, confirming strategies, and optimizing time efficiency.
Key Features
- Accurate NovoCure Financials: Gain access to reliable pre-loaded historical data and future forecasts.
- Tailored Forecast Assumptions: Modify highlighted cells such as WACC, growth rates, and profit margins.
- Real-Time Calculations: Automatic updates to DCF, Net Present Value (NPV), and cash flow assessments.
- Interactive Dashboard: User-friendly charts and summaries to help visualize your valuation outcomes.
- Designed for All Levels: An intuitive layout suitable for investors, CFOs, and consultants alike.
How It Works
- Download: Obtain the pre-prepared Excel file containing NovoCure Limited’s (NVCR) financial data.
- Customize: Modify projections, such as revenue growth, EBITDA %, and WACC.
- Update Automatically: The intrinsic value and NPV calculations refresh in real-time.
- Test Scenarios: Develop various projections and evaluate outcomes instantly.
- Make Decisions: Leverage the valuation results to inform your investment strategy.
Why Choose This Calculator for NovoCure Limited (NVCR)?
- Accuracy: Utilizes real NovoCure financials for precise data representation.
- Flexibility: Allows users to experiment and adjust inputs effortlessly.
- Time-Saving: Avoid the complexity of constructing a DCF model from the ground up.
- Professional-Grade: Crafted with the expertise and usability expected at the CFO level.
- User-Friendly: Intuitive interface suitable for users without extensive financial modeling skills.
Who Should Use NovoCure Limited (NVCR)?
- Investors: Gain insights into innovative cancer treatments and make informed investment choices.
- Healthcare Analysts: Utilize comprehensive data to evaluate NovoCure's market position and growth potential.
- Consultants: Tailor presentations for clients interested in biotechnology and healthcare advancements.
- Medical Researchers: Explore the latest developments in tumor treatment technologies and their implications.
- Students and Educators: Leverage real-world case studies for a deeper understanding of the biotech industry.
What the Template Contains
- Preloaded NVCR Data: Historical and projected financial data, including revenue, EBIT, and capital expenditures.
- DCF and WACC Models: Professional-grade sheets for calculating intrinsic value and Weighted Average Cost of Capital.
- Editable Inputs: Yellow-highlighted cells for adjusting revenue growth, tax rates, and discount rates.
- Financial Statements: Comprehensive annual and quarterly financials for deeper analysis.
- Key Ratios: Profitability, leverage, and efficiency ratios to evaluate performance.
- Dashboard and Charts: Visual summaries of valuation outcomes and assumptions.
Disclaimer
All information, articles, and product details provided on this website are for general informational and educational purposes only. We do not claim any ownership over, nor do we intend to infringe upon, any trademarks, copyrights, logos, brand names, or other intellectual property mentioned or depicted on this site. Such intellectual property remains the property of its respective owners, and any references here are made solely for identification or informational purposes, without implying any affiliation, endorsement, or partnership.
We make no representations or warranties, express or implied, regarding the accuracy, completeness, or suitability of any content or products presented. Nothing on this website should be construed as legal, tax, investment, financial, medical, or other professional advice. In addition, no part of this site—including articles or product references—constitutes a solicitation, recommendation, endorsement, advertisement, or offer to buy or sell any securities, franchises, or other financial instruments, particularly in jurisdictions where such activity would be unlawful.
All content is of a general nature and may not address the specific circumstances of any individual or entity. It is not a substitute for professional advice or services. Any actions you take based on the information provided here are strictly at your own risk. You accept full responsibility for any decisions or outcomes arising from your use of this website and agree to release us from any liability in connection with your use of, or reliance upon, the content or products found herein.