
|
شركة Quanex Building Products (NX) تقييم DCF |
Fully Editable: Tailor To Your Needs In Excel Or Sheets
Professional Design: Trusted, Industry-Standard Templates
Investor-Approved Valuation Models
MAC/PC Compatible, Fully Unlocked
No Expertise Is Needed; Easy To Follow
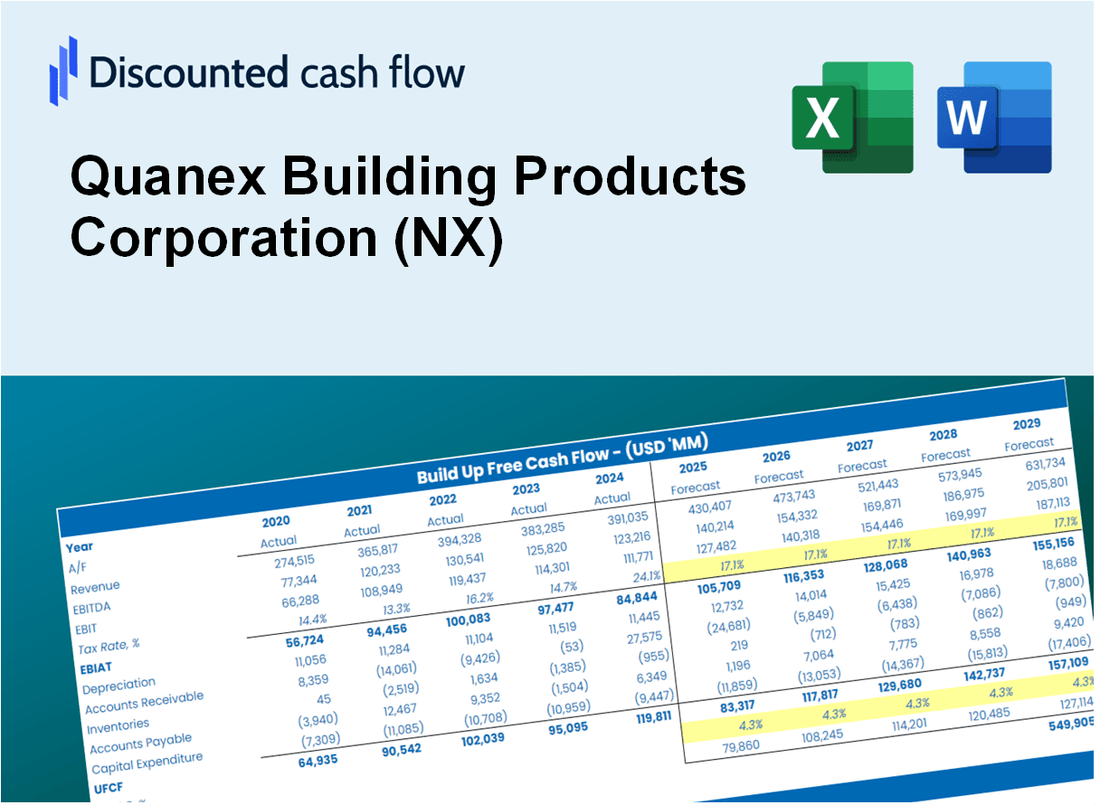
Quanex Building Products Corporation (NX) Bundle
تعظيم الكفاءة وتحسين الدقة باستخدام حاسبة DCF (NX)! باستخدام بيانات Quanex Building Products Corporation الحقيقية والافتراضات القابلة للتخصيص، تمكنك هذه الأداة من التنبؤ بـ Quanex وتحليله وتقييمه كمستثمر متمرس.
What You Will Get
- Real NX Financial Data: Pre-filled with Quanex Building Products Corporation’s historical and projected data for precise analysis.
- Fully Editable Template: Modify key inputs like revenue growth, WACC, and EBITDA % with ease.
- Automatic Calculations: See Quanex’s intrinsic value update instantly based on your changes.
- Professional Valuation Tool: Designed for investors, analysts, and consultants seeking accurate DCF results.
- User-Friendly Design: Simple structure and clear instructions for all experience levels.
Key Features
- Accurate Financial Data: Gain access to reliable historical performance metrics and future forecasts for Quanex Building Products Corporation (NX).
- Adjustable Forecast Parameters: Modify highlighted cells for key variables such as WACC, growth rates, and profit margins.
- Real-Time Calculations: Enjoy automatic recalculations for DCF, Net Present Value (NPV), and cash flow assessments.
- User-Friendly Dashboard: Intuitive charts and summaries to help visualize your valuation findings effectively.
- Suitable for All Levels: Designed with a straightforward layout for investors, CFOs, and consultants alike.
How It Works
- Step 1: Download the Excel file for Quanex Building Products Corporation (NX).
- Step 2: Review the pre-filled financial data and forecasts for Quanex.
- Step 3: Adjust key inputs such as revenue growth, WACC, and tax rates (highlighted cells).
- Step 4: Observe the DCF model update in real-time as you modify your assumptions.
- Step 5: Evaluate the outputs and leverage the results for your investment strategies.
Why Choose This Calculator for Quanex Building Products Corporation (NX)?
- Designed for Industry Experts: A sophisticated tool favored by analysts, financial officers, and industry consultants.
- Comprehensive Data: Quanex’s historical and projected financials are preloaded for enhanced accuracy.
- Flexible Scenario Analysis: Effortlessly simulate various forecasts and assumptions.
- Insightful Outputs: Automatically computes intrinsic value, NPV, and essential metrics.
- User-Friendly Interface: Step-by-step guidance ensures a smooth calculation process.
Who Should Use This Product?
- Construction Management Students: Understand industry valuation methods and apply them with real market data.
- Researchers: Utilize advanced models in your studies or publications related to building products.
- Investors: Evaluate your investment strategies and assess valuation metrics for Quanex Building Products Corporation (NX).
- Market Analysts: Enhance your analysis process with a tailored, ready-to-use DCF model.
- Contractors: Discover how major manufacturers like Quanex are evaluated in the market.
What the Template Contains
- Historical Data: Includes Quanex Building Products Corporation’s past financials and baseline forecasts.
- DCF and Levered DCF Models: Detailed templates to calculate Quanex Building Products Corporation’s intrinsic value.
- WACC Sheet: Pre-built calculations for Weighted Average Cost of Capital.
- Editable Inputs: Modify key drivers like growth rates, EBITDA %, and CAPEX assumptions.
- Quarterly and Annual Statements: A complete breakdown of Quanex Building Products Corporation’s financials.
- Interactive Dashboard: Visualize valuation results and projections dynamically.
Disclaimer
All information, articles, and product details provided on this website are for general informational and educational purposes only. We do not claim any ownership over, nor do we intend to infringe upon, any trademarks, copyrights, logos, brand names, or other intellectual property mentioned or depicted on this site. Such intellectual property remains the property of its respective owners, and any references here are made solely for identification or informational purposes, without implying any affiliation, endorsement, or partnership.
We make no representations or warranties, express or implied, regarding the accuracy, completeness, or suitability of any content or products presented. Nothing on this website should be construed as legal, tax, investment, financial, medical, or other professional advice. In addition, no part of this site—including articles or product references—constitutes a solicitation, recommendation, endorsement, advertisement, or offer to buy or sell any securities, franchises, or other financial instruments, particularly in jurisdictions where such activity would be unlawful.
All content is of a general nature and may not address the specific circumstances of any individual or entity. It is not a substitute for professional advice or services. Any actions you take based on the information provided here are strictly at your own risk. You accept full responsibility for any decisions or outcomes arising from your use of this website and agree to release us from any liability in connection with your use of, or reliance upon, the content or products found herein.