
|
تقييم Oncocyte Corporation (OCX) DCF |
Fully Editable: Tailor To Your Needs In Excel Or Sheets
Professional Design: Trusted, Industry-Standard Templates
Investor-Approved Valuation Models
MAC/PC Compatible, Fully Unlocked
No Expertise Is Needed; Easy To Follow
OncoCyte Corporation (OCX) Bundle
قم بتعزيز اختياراتك الاستثمارية باستخدام حاسبة DCF التابعة لشركة OncoCyte Corporation (OCX)! استخدم بيانات OncoCyte المالية الحقيقية، واضبط تنبؤات النمو ونفقاته، ولاحظ على الفور كيف تؤثر هذه التعديلات على القيمة الجوهرية لشركة OncoCyte Corporation (OCX).
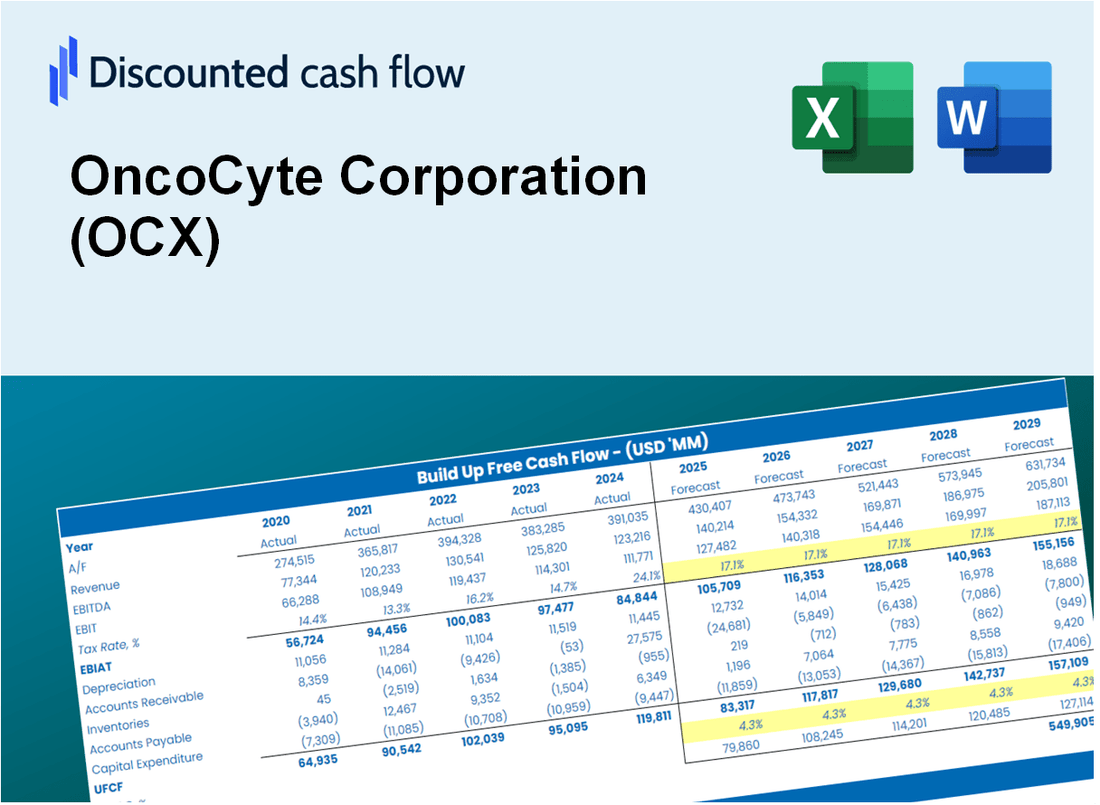
Discounted Cash Flow (DCF) - (USD MM)
| Year | AY1 2020 |
AY2 2021 |
AY3 2022 |
AY4 2023 |
AY5 2024 |
FY1 2025 |
FY2 2026 |
FY3 2027 |
FY4 2028 |
FY5 2029 |
|---|---|---|---|---|---|---|---|---|---|---|
| Revenue | 1.2 | 7.7 | 1.0 | 1.5 | 1.9 | 2.3 | 2.9 | 3.6 | 4.4 | 5.4 |
| Revenue Growth, % | 0 | 535.44 | -87.6 | 56.89 | 25.15 | 23.61 | 23.61 | 23.61 | 23.61 | 23.61 |
| EBITDA | -30.5 | -48.5 | -13.3 | -23.1 | -59.0 | -2.3 | -2.9 | -3.6 | -4.4 | -5.4 |
| EBITDA, % | -2511.51 | -627.11 | -1389.87 | -1538.46 | -3137.43 | -100 | -100 | -100 | -100 | -100 |
| Depreciation | .4 | 4.2 | 5.2 | 1.7 | 1.6 | 1.7 | 2.1 | 2.6 | 3.2 | 4.0 |
| Depreciation, % | 32.4 | 54.42 | 544.89 | 111.78 | 83.15 | 73.99 | 73.99 | 73.99 | 73.99 | 73.99 |
| EBIT | -30.9 | -52.7 | -18.5 | -24.8 | -60.6 | -2.3 | -2.9 | -3.6 | -4.4 | -5.4 |
| EBIT, % | -2543.91 | -681.53 | -1934.76 | -1650.23 | -3220.57 | -100 | -100 | -100 | -100 | -100 |
| Total Cash | 7.8 | 36.5 | 20.4 | 9.4 | 8.6 | 2.3 | 2.9 | 3.6 | 4.4 | 5.4 |
| Total Cash, percent | .0 | .0 | .0 | .0 | .0 | .0 | .0 | .0 | .0 | .0 |
| Account Receivables | .2 | 1.4 | 2.0 | .5 | 1.6 | 1.2 | 1.5 | 1.8 | 2.2 | 2.7 |
| Account Receivables, % | 16.69 | 18.6 | 210.02 | 32.2 | 85.75 | 50.65 | 50.65 | 50.65 | 50.65 | 50.65 |
| Inventories | .0 | .3 | 2.1 | .0 | .4 | .6 | .7 | .9 | 1.1 | 1.4 |
| Inventories, % | 0 | 3.93 | 221.4 | 0 | 21.8 | 25.15 | 25.15 | 25.15 | 25.15 | 25.15 |
| Accounts Payable | .4 | 1.8 | 1.3 | 1.0 | 2.3 | 1.5 | 1.9 | 2.3 | 2.8 | 3.5 |
| Accounts Payable, % | 35.53 | 23.42 | 130.79 | 63.41 | 121.16 | 64.47 | 64.47 | 64.47 | 64.47 | 64.47 |
| Capital Expenditure | -1.2 | -2.2 | -4.3 | -.3 | -.5 | -1.3 | -1.6 | -2.0 | -2.4 | -3.0 |
| Capital Expenditure, % | -100.9 | -29.08 | -453.03 | -18.7 | -27.43 | -55.04 | -55.04 | -55.04 | -55.04 | -55.04 |
| Tax Rate, % | 0 | 0 | 0 | 0 | 0 | 0 | 0 | 0 | 0 | 0 |
| EBITAT | -29.7 | -46.0 | -73.1 | -27.7 | -60.6 | -2.2 | -2.8 | -3.4 | -4.2 | -5.2 |
| Depreciation | ||||||||||
| Changes in Account Receivables | ||||||||||
| Changes in Inventories | ||||||||||
| Changes in Accounts Payable | ||||||||||
| Capital Expenditure | ||||||||||
| UFCF | -30.3 | -44.2 | -75.2 | -23.0 | -59.7 | -2.3 | -2.3 | -2.8 | -3.5 | -4.3 |
| WACC, % | 8.22 | 8.18 | 8.23 | 8.23 | 8.23 | 8.22 | 8.22 | 8.22 | 8.22 | 8.22 |
| PV UFCF | ||||||||||
| SUM PV UFCF | -11.8 | |||||||||
| Long Term Growth Rate, % | 2.00 | |||||||||
| Free cash flow (T + 1) | -4 | |||||||||
| Terminal Value | -71 | |||||||||
| Present Terminal Value | -48 | |||||||||
| Enterprise Value | -60 | |||||||||
| Net Debt | -5 | |||||||||
| Equity Value | -55 | |||||||||
| Diluted Shares Outstanding, MM | 13 | |||||||||
| Equity Value Per Share | -4.19 |
What You Will Get
- Comprehensive OCX Financials: Access to historical and projected data for precise valuation.
- Customizable Inputs: Adjust WACC, tax rates, revenue growth, and capital expenditures as needed.
- Dynamic Calculations: Intrinsic value and NPV are computed in real-time.
- Scenario Analysis: Explore various scenarios to assess OncoCyte’s future performance.
- User-Friendly Design: Designed for professionals while remaining approachable for newcomers.
Key Features
- Real-Life OCX Data: Pre-filled with OncoCyte Corporation’s historical financials and future projections.
- Fully Customizable Inputs: Modify revenue growth, profit margins, WACC, tax rates, and capital expenditures.
- Dynamic Valuation Model: Automatic updates to Net Present Value (NPV) and intrinsic value based on your adjustments.
- Scenario Testing: Develop multiple forecasting scenarios to evaluate different valuation results.
- User-Friendly Design: Intuitive, organized, and tailored for both professionals and novices.
How It Works
- 1. Access the Template: Download and open the Excel file containing OncoCyte Corporation’s (OCX) preloaded data.
- 2. Modify Assumptions: Adjust key inputs such as growth rates, WACC, and capital expenditures.
- 3. Analyze Results Immediately: The DCF model automatically calculates intrinsic value and NPV.
- 4. Explore Scenarios: Evaluate various forecasts to assess different valuation possibilities.
- 5. Present with Assurance: Share professional valuation insights to back your decision-making process.
Why Choose This Calculator for OncoCyte Corporation (OCX)?
- Accuracy: Utilizes real OncoCyte financial data for precise calculations.
- Flexibility: Allows users to easily test and adjust inputs as needed.
- Time-Saving: Avoid the complexities of creating a DCF model from the ground up.
- Professional-Grade: Crafted with the expertise and standards expected by CFOs.
- User-Friendly: Intuitive design makes it accessible for users with varying levels of financial expertise.
Who Should Use This Product?
- Individual Investors: Make informed decisions about buying or selling OncoCyte Corporation (OCX) stock.
- Financial Analysts: Streamline valuation processes with ready-to-use financial models for OncoCyte Corporation (OCX).
- Consultants: Deliver professional valuation insights on OncoCyte Corporation (OCX) to clients quickly and accurately.
- Business Owners: Understand how biotech companies like OncoCyte Corporation (OCX) are valued to guide your own strategy.
- Finance Students: Learn valuation techniques using real-world data and scenarios related to OncoCyte Corporation (OCX).
What the Template Contains
- Pre-Filled Data: Includes OncoCyte Corporation’s historical financials and projections.
- Discounted Cash Flow Model: Editable DCF valuation model with automated calculations.
- Weighted Average Cost of Capital (WACC): A dedicated sheet for calculating WACC based on user-defined inputs.
- Key Financial Ratios: Assess OncoCyte Corporation’s profitability, efficiency, and leverage.
- Customizable Inputs: Easily modify revenue growth, margins, and tax rates.
- Clear Dashboard: Visual representations and tables summarizing essential valuation outcomes.
Disclaimer
All information, articles, and product details provided on this website are for general informational and educational purposes only. We do not claim any ownership over, nor do we intend to infringe upon, any trademarks, copyrights, logos, brand names, or other intellectual property mentioned or depicted on this site. Such intellectual property remains the property of its respective owners, and any references here are made solely for identification or informational purposes, without implying any affiliation, endorsement, or partnership.
We make no representations or warranties, express or implied, regarding the accuracy, completeness, or suitability of any content or products presented. Nothing on this website should be construed as legal, tax, investment, financial, medical, or other professional advice. In addition, no part of this site—including articles or product references—constitutes a solicitation, recommendation, endorsement, advertisement, or offer to buy or sell any securities, franchises, or other financial instruments, particularly in jurisdictions where such activity would be unlawful.
All content is of a general nature and may not address the specific circumstances of any individual or entity. It is not a substitute for professional advice or services. Any actions you take based on the information provided here are strictly at your own risk. You accept full responsibility for any decisions or outcomes arising from your use of this website and agree to release us from any liability in connection with your use of, or reliance upon, the content or products found herein.