
|
Orion Energy Systems ، Inc. (OESX) DCF تقييم |
Fully Editable: Tailor To Your Needs In Excel Or Sheets
Professional Design: Trusted, Industry-Standard Templates
Investor-Approved Valuation Models
MAC/PC Compatible, Fully Unlocked
No Expertise Is Needed; Easy To Follow
Orion Energy Systems, Inc. (OESX) Bundle
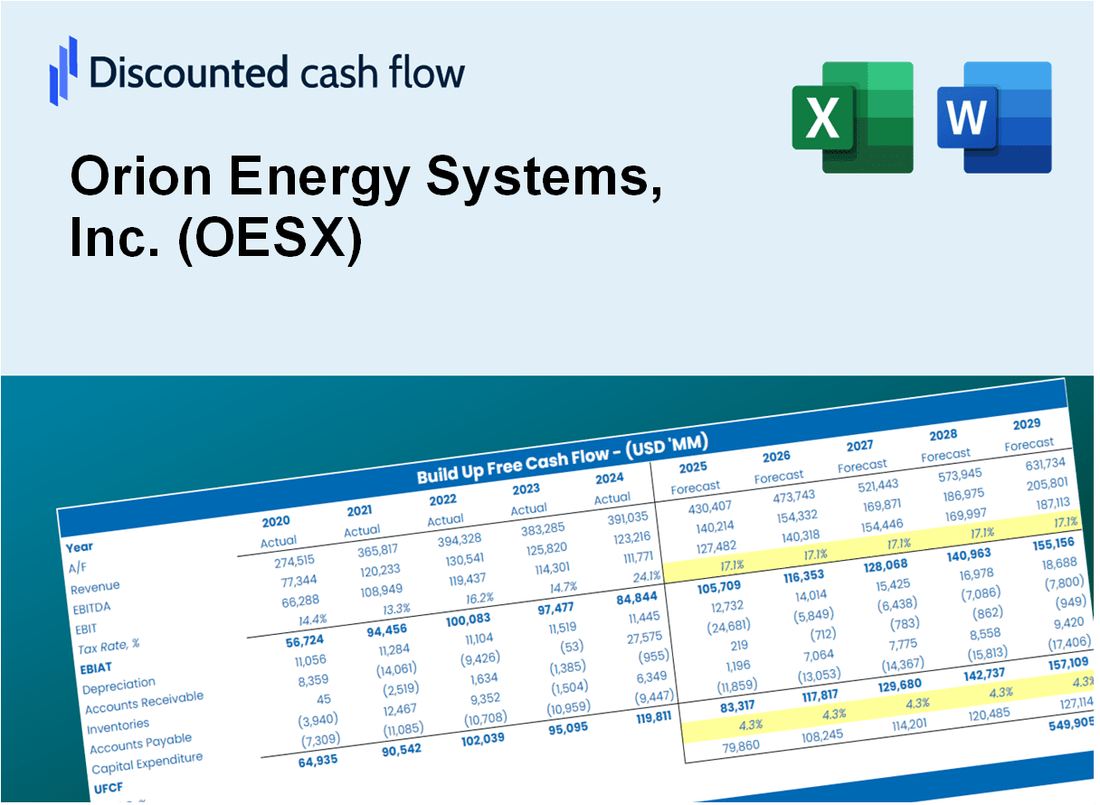
تقييم التوقعات المالية لشركة Orion Energy ، Inc. (OESX) مثل خبير! توفر حاسبة DCF (OESX) هذه البيانات المالية المليئة مسبقًا والمرونة لتعديل نمو الإيرادات ، WACC ، الهوامش ، وغيرها من الافتراضات الأساسية التي تتماشى مع توقعاتك.
Discounted Cash Flow (DCF) - (USD MM)
| Year | AY1 2020 |
AY2 2021 |
AY3 2022 |
AY4 2023 |
AY5 2024 |
FY1 2025 |
FY2 2026 |
FY3 2027 |
FY4 2028 |
FY5 2029 |
|---|---|---|---|---|---|---|---|---|---|---|
| Revenue | 116.8 | 124.4 | 77.4 | 90.6 | 79.7 | 74.5 | 69.6 | 65.0 | 60.8 | 56.8 |
| Revenue Growth, % | 0 | 6.46 | -37.79 | 17.06 | -11.99 | -6.57 | -6.57 | -6.57 | -6.57 | -6.57 |
| EBITDA | 8.1 | 9.9 | -14.0 | -8.4 | -8.3 | -3.4 | -3.2 | -3.0 | -2.8 | -2.6 |
| EBITDA, % | 6.95 | 7.95 | -18.09 | -9.25 | -10.44 | -4.58 | -4.58 | -4.58 | -4.58 | -4.58 |
| Depreciation | 1.5 | 1.6 | 2.0 | 2.5 | 2.4 | 1.6 | 1.5 | 1.4 | 1.3 | 1.2 |
| Depreciation, % | 1.27 | 1.25 | 2.61 | 2.75 | 3.03 | 2.18 | 2.18 | 2.18 | 2.18 | 2.18 |
| EBIT | 6.6 | 8.3 | -16.0 | -10.9 | -10.7 | -5.0 | -4.7 | -4.4 | -4.1 | -3.8 |
| EBIT, % | 5.69 | 6.7 | -20.71 | -12.01 | -13.46 | -6.76 | -6.76 | -6.76 | -6.76 | -6.76 |
| Total Cash | 19.4 | 14.5 | 16.0 | 5.2 | 6.0 | 9.2 | 8.6 | 8.1 | 7.5 | 7.0 |
| Total Cash, percent | .0 | .0 | .0 | .0 | .0 | .0 | .0 | .0 | .0 | .0 |
| Account Receivables | 16.5 | 15.9 | 15.0 | 18.6 | 16.2 | 13.0 | 12.1 | 11.3 | 10.6 | 9.9 |
| Account Receivables, % | 14.12 | 12.79 | 19.45 | 20.49 | 20.31 | 17.43 | 17.43 | 17.43 | 17.43 | 17.43 |
| Inventories | 19.6 | 19.8 | 18.2 | 18.2 | 11.4 | 13.5 | 12.6 | 11.8 | 11.0 | 10.3 |
| Inventories, % | 16.74 | 15.94 | 23.53 | 20.14 | 14.29 | 18.13 | 18.13 | 18.13 | 18.13 | 18.13 |
| Accounts Payable | 17.0 | 9.9 | 13.4 | 18.4 | 13.3 | 11.4 | 10.7 | 10.0 | 9.3 | 8.7 |
| Accounts Payable, % | 14.59 | 7.92 | 17.32 | 20.26 | 16.65 | 15.35 | 15.35 | 15.35 | 15.35 | 15.35 |
| Capital Expenditure | -1.0 | -.5 | -.6 | -.8 | -.1 | -.5 | -.4 | -.4 | -.4 | -.3 |
| Capital Expenditure, % | -0.81565 | -0.4245 | -0.7689 | -0.92403 | -0.13171 | -0.61296 | -0.61296 | -0.61296 | -0.61296 | -0.61296 |
| Tax Rate, % | -0.35717 | -0.35717 | -0.35717 | -0.35717 | -0.35717 | -0.35717 | -0.35717 | -0.35717 | -0.35717 | -0.35717 |
| EBITAT | 26.6 | 6.2 | -33.6 | -10.9 | -10.8 | -4.8 | -4.5 | -4.2 | -3.9 | -3.6 |
| Depreciation | ||||||||||
| Changes in Account Receivables | ||||||||||
| Changes in Inventories | ||||||||||
| Changes in Accounts Payable | ||||||||||
| Capital Expenditure | ||||||||||
| UFCF | 8.2 | .3 | -26.2 | -7.9 | -4.3 | -4.3 | -2.4 | -2.2 | -2.1 | -1.9 |
| WACC, % | 7.32 | 6.81 | 7.32 | 7.32 | 7.32 | 7.22 | 7.22 | 7.22 | 7.22 | 7.22 |
| PV UFCF | ||||||||||
| SUM PV UFCF | -10.9 | |||||||||
| Long Term Growth Rate, % | 2.00 | |||||||||
| Free cash flow (T + 1) | -2 | |||||||||
| Terminal Value | -38 | |||||||||
| Present Terminal Value | -27 | |||||||||
| Enterprise Value | -38 | |||||||||
| Net Debt | 4 | |||||||||
| Equity Value | -42 | |||||||||
| Diluted Shares Outstanding, MM | 3 | |||||||||
| Equity Value Per Share | -12.78 |
What You Will Gain
- Comprehensive Financial Model: Orion Energy Systems’ actual data facilitates accurate DCF valuation.
- Complete Forecast Flexibility: Modify revenue growth, profit margins, WACC, and other critical factors.
- Real-Time Calculations: Automatic updates allow you to view results instantly as you make adjustments.
- Professional-Grade Template: A polished Excel file crafted for high-quality valuation presentations.
- Adaptable and Reusable: Designed for versatility, enabling multiple uses for in-depth forecasts.
Key Features
- Comprehensive Data: Orion Energy Systems' historical financial statements and pre-filled projections.
- Customizable Inputs: Adjust WACC, tax rates, revenue growth, and EBITDA margins as needed.
- Real-Time Results: Watch Orion Energy Systems' intrinsic value update instantly.
- Intuitive Visual Outputs: Dashboard charts illustrate valuation results and essential metrics.
- Designed for Precision: A professional-grade tool for analysts, investors, and finance professionals.
How It Works
- Download: Get the pre-built Excel file containing Orion Energy Systems, Inc. (OESX) financial data.
- Customize: Modify key metrics, such as revenue projections, EBITDA %, and WACC.
- Update Automatically: The intrinsic value and NPV calculations refresh in real-time.
- Test Scenarios: Develop various forecasts and instantly analyze different outcomes.
- Make Decisions: Leverage the valuation insights to inform your investment approach.
Why Choose Orion Energy Systems, Inc. (OESX)?
- Save Time: Quickly access energy solutions without the hassle of lengthy setups.
- Enhance Efficiency: Innovative technologies ensure optimal performance and energy savings.
- Fully Customizable: Adapt our products to meet your unique energy needs and goals.
- Easy to Use: User-friendly interfaces simplify operations and monitoring.
- Backed by Expertise: Developed by industry leaders dedicated to sustainable energy solutions.
Who Should Use This Product?
- Investors: Accurately assess Orion Energy Systems, Inc.'s (OESX) fair value before making investment choices.
- CFOs: Utilize a professional-grade DCF model for financial analysis and reporting related to (OESX).
- Consultants: Easily customize the template for valuation reports tailored to clients interested in (OESX).
- Entrepreneurs: Acquire insights into financial modeling practices employed by leading companies in the energy sector, including (OESX).
- Educators: Implement it as a teaching resource to illustrate valuation methodologies relevant to (OESX).
What the Template Contains
- Pre-Filled Data: Includes Orion Energy Systems, Inc.'s (OESX) historical financials and forecasts.
- Discounted Cash Flow Model: Editable DCF valuation model with automatic calculations.
- Weighted Average Cost of Capital (WACC): A dedicated sheet for calculating WACC based on custom inputs.
- Key Financial Ratios: Analyze Orion Energy Systems, Inc.'s (OESX) profitability, efficiency, and leverage.
- Customizable Inputs: Edit revenue growth, margins, and tax rates with ease.
- Clear Dashboard: Charts and tables summarizing key valuation results.
Disclaimer
All information, articles, and product details provided on this website are for general informational and educational purposes only. We do not claim any ownership over, nor do we intend to infringe upon, any trademarks, copyrights, logos, brand names, or other intellectual property mentioned or depicted on this site. Such intellectual property remains the property of its respective owners, and any references here are made solely for identification or informational purposes, without implying any affiliation, endorsement, or partnership.
We make no representations or warranties, express or implied, regarding the accuracy, completeness, or suitability of any content or products presented. Nothing on this website should be construed as legal, tax, investment, financial, medical, or other professional advice. In addition, no part of this site—including articles or product references—constitutes a solicitation, recommendation, endorsement, advertisement, or offer to buy or sell any securities, franchises, or other financial instruments, particularly in jurisdictions where such activity would be unlawful.
All content is of a general nature and may not address the specific circumstances of any individual or entity. It is not a substitute for professional advice or services. Any actions you take based on the information provided here are strictly at your own risk. You accept full responsibility for any decisions or outcomes arising from your use of this website and agree to release us from any liability in connection with your use of, or reliance upon, the content or products found herein.