
|
Omega Flex ، Inc. (OFLX) DCF تقييم |
Fully Editable: Tailor To Your Needs In Excel Or Sheets
Professional Design: Trusted, Industry-Standard Templates
Investor-Approved Valuation Models
MAC/PC Compatible, Fully Unlocked
No Expertise Is Needed; Easy To Follow
Omega Flex, Inc. (OFLX) Bundle
اكتشف القيمة الحقيقية لـ Omega Flex ، Inc. (OFLX) مع حاسبة DCF المتقدمة! اضبط الافتراضات الرئيسية ، واستكشف السيناريوهات المختلفة ، وتقييم كيفية تأثير التغييرات المختلفة على تقييم أوميغا فليكس - كل ذلك ضمن قالب Excel واحد مناسب.
What You Will Receive
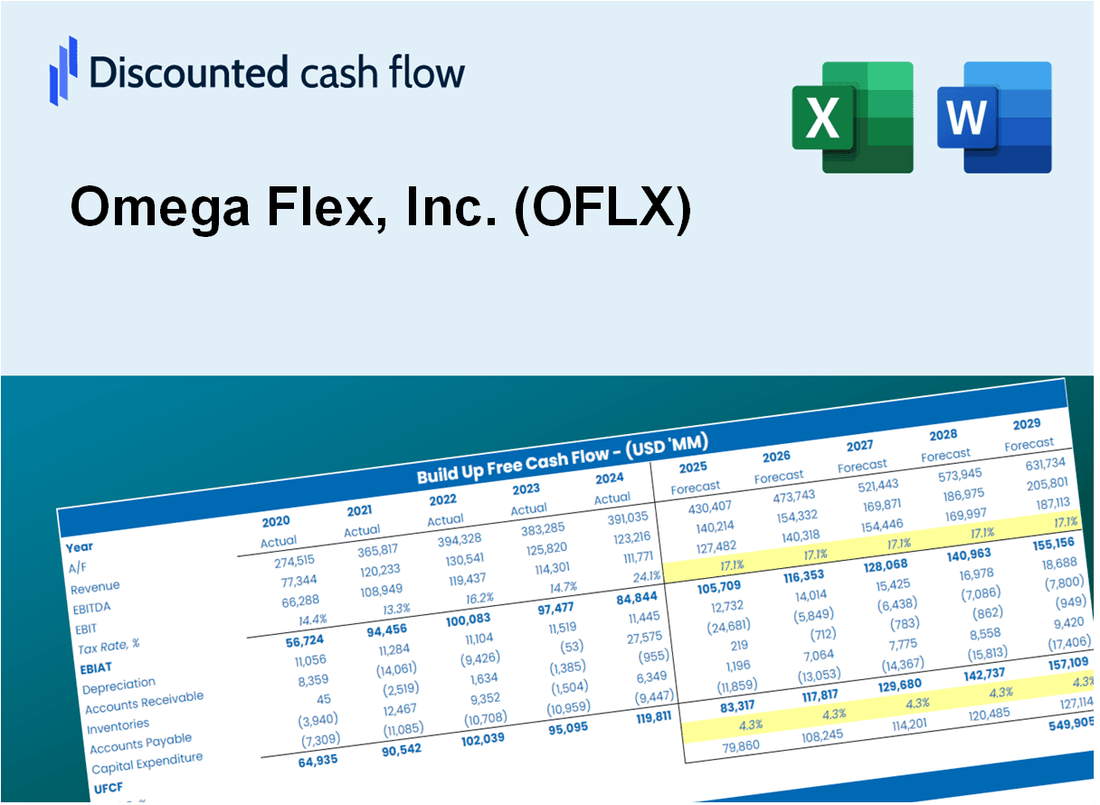
- Comprehensive Financial Model: Omega Flex, Inc.’s (OFLX) actual data facilitates accurate DCF valuation.
- Complete Forecast Flexibility: Modify revenue growth, profit margins, WACC, and other essential metrics.
- Real-Time Calculations: Automatic updates provide immediate insights as adjustments are made.
- Professional-Grade Template: A polished Excel file crafted for high-quality valuation needs.
- Adaptable and Reusable: Designed for versatility, enabling frequent use for in-depth forecasting.
Key Features
- Comprehensive Historical Data: Omega Flex, Inc.’s (OFLX) past financial statements and detailed forecasts.
- Customizable Parameters: Adjust WACC, tax rates, revenue growth, and EBITDA margins as needed.
- Real-Time Insights: Monitor Omega Flex’s (OFLX) intrinsic value updates instantly.
- Intuitive Visual Representations: Dashboard graphs illustrate valuation outcomes and essential metrics.
- Engineered for Precision: A robust tool tailored for analysts, investors, and finance professionals.
How It Works
- Download the Template: Gain immediate access to the Excel-based OFLX DCF Calculator.
- Input Your Assumptions: Modify yellow-highlighted cells for growth rates, WACC, margins, and other variables.
- Instant Calculations: The model automatically recalculates Omega Flex’s intrinsic value.
- Test Scenarios: Experiment with various assumptions to assess potential valuation fluctuations.
- Analyze and Decide: Leverage the results to inform your investment or financial analysis.
Why Choose This Calculator for Omega Flex, Inc. (OFLX)?
- Designed for Experts: A sophisticated tool utilized by financial analysts, CFOs, and industry consultants.
- Accurate Data: Omega Flex’s historical and projected financials are preloaded for precise calculations.
- Flexible Scenario Analysis: Effortlessly simulate various forecasts and assumptions.
- Comprehensive Outputs: Automatically computes intrinsic value, NPV, and essential metrics.
- User-Friendly: Step-by-step guidance ensures a smooth experience throughout the process.
Who Should Use This Product?
- Investors: Evaluate Omega Flex, Inc.'s (OFLX) financial health before making investment decisions.
- CFOs and Financial Analysts: Optimize valuation methodologies and assess future projections for Omega Flex.
- Startup Founders: Understand the valuation strategies of established companies like Omega Flex, Inc. (OFLX).
- Consultants: Provide comprehensive valuation assessments for clients involving Omega Flex, Inc. (OFLX).
- Students and Educators: Utilize Omega Flex, Inc. (OFLX) data to practice and teach valuation principles.
What the Template Contains
- Pre-Filled Data: Includes Omega Flex, Inc.'s (OFLX) historical financials and projections.
- Discounted Cash Flow Model: Editable DCF valuation model featuring automatic calculations.
- Weighted Average Cost of Capital (WACC): A dedicated sheet for determining WACC based on user-defined inputs.
- Key Financial Ratios: Evaluate Omega Flex, Inc.'s (OFLX) profitability, efficiency, and leverage metrics.
- Customizable Inputs: Easily modify revenue growth, margins, and tax rates.
- Clear Dashboard: Visual representations and tables summarizing essential valuation outcomes.
Disclaimer
All information, articles, and product details provided on this website are for general informational and educational purposes only. We do not claim any ownership over, nor do we intend to infringe upon, any trademarks, copyrights, logos, brand names, or other intellectual property mentioned or depicted on this site. Such intellectual property remains the property of its respective owners, and any references here are made solely for identification or informational purposes, without implying any affiliation, endorsement, or partnership.
We make no representations or warranties, express or implied, regarding the accuracy, completeness, or suitability of any content or products presented. Nothing on this website should be construed as legal, tax, investment, financial, medical, or other professional advice. In addition, no part of this site—including articles or product references—constitutes a solicitation, recommendation, endorsement, advertisement, or offer to buy or sell any securities, franchises, or other financial instruments, particularly in jurisdictions where such activity would be unlawful.
All content is of a general nature and may not address the specific circumstances of any individual or entity. It is not a substitute for professional advice or services. Any actions you take based on the information provided here are strictly at your own risk. You accept full responsibility for any decisions or outcomes arising from your use of this website and agree to release us from any liability in connection with your use of, or reliance upon, the content or products found herein.