
|
OGE Energy Corp. (OGE) DCF تقييم |
Fully Editable: Tailor To Your Needs In Excel Or Sheets
Professional Design: Trusted, Industry-Standard Templates
Investor-Approved Valuation Models
MAC/PC Compatible, Fully Unlocked
No Expertise Is Needed; Easy To Follow
OGE Energy Corp. (OGE) Bundle
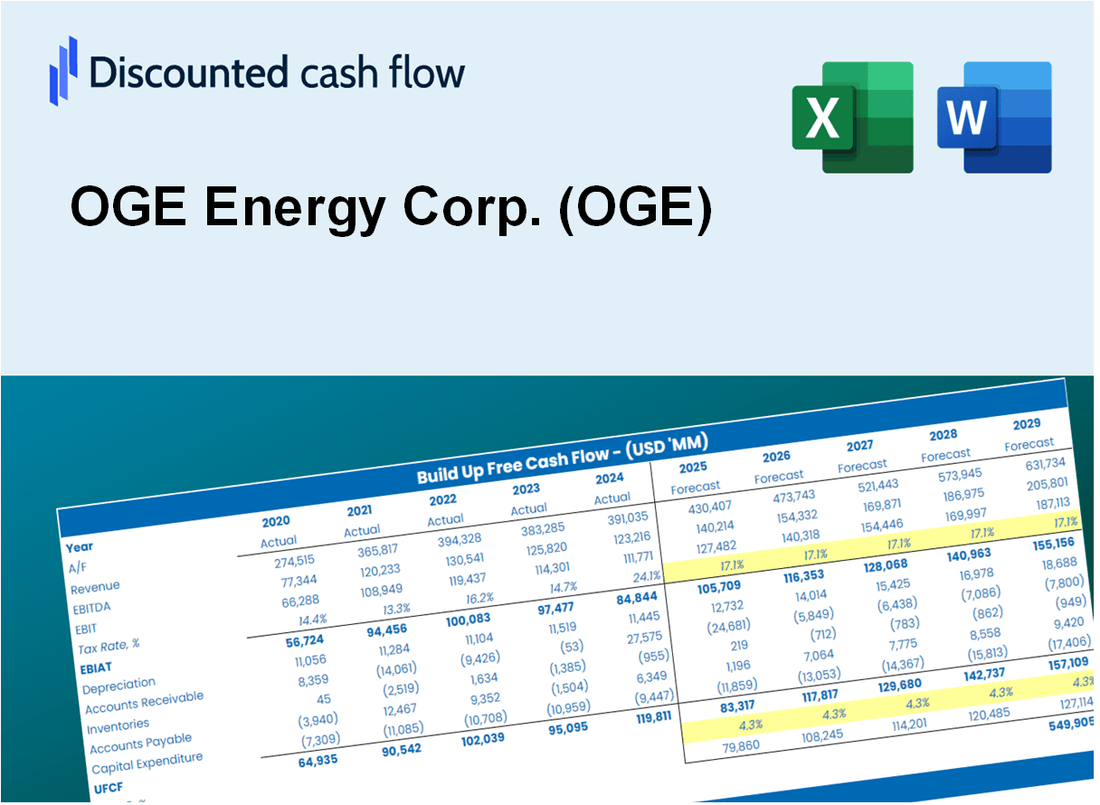
تقييم التوقعات المالية لشركة OGE Energy Corp (OGE) مثل خبير! توفر حاسبة (OGE) DCF بيانات مالية مملوءة مسبقًا إلى جانب المرونة لتعديل نمو الإيرادات ، WACC ، الهوامش ، وغيرها من الافتراضات الأساسية التي تتماشى مع توقعاتك.
Discounted Cash Flow (DCF) - (USD MM)
| Year | AY1 2020 |
AY2 2021 |
AY3 2022 |
AY4 2023 |
AY5 2024 |
FY1 2025 |
FY2 2026 |
FY3 2027 |
FY4 2028 |
FY5 2029 |
|---|---|---|---|---|---|---|---|---|---|---|
| Revenue | 2,122.3 | 3,653.7 | 3,375.7 | 2,674.3 | 2,985.3 | 3,173.0 | 3,372.6 | 3,584.7 | 3,810.1 | 4,049.7 |
| Revenue Growth, % | 0 | 72.16 | -7.61 | -20.78 | 11.63 | 6.29 | 6.29 | 6.29 | 6.29 | 6.29 |
| EBITDA | 250.6 | 1,456.3 | 1,416.5 | 1,201.0 | 1,314.6 | 1,158.6 | 1,231.5 | 1,308.9 | 1,391.3 | 1,478.7 |
| EBITDA, % | 11.81 | 39.86 | 41.96 | 44.91 | 44.04 | 36.51 | 36.51 | 36.51 | 36.51 | 36.51 |
| Depreciation | 391.3 | 416.0 | 460.9 | 506.6 | 539.5 | 510.8 | 542.9 | 577.1 | 613.4 | 651.9 |
| Depreciation, % | 18.44 | 11.39 | 13.65 | 18.94 | 18.07 | 16.1 | 16.1 | 16.1 | 16.1 | 16.1 |
| EBIT | -140.7 | 1,040.3 | 955.6 | 694.4 | 775.1 | 647.8 | 688.6 | 731.9 | 777.9 | 826.8 |
| EBIT, % | -6.63 | 28.47 | 28.31 | 25.97 | 25.96 | 20.42 | 20.42 | 20.42 | 20.42 | 20.42 |
| Total Cash | 1.1 | .0 | 88.1 | .2 | .6 | 17.1 | 18.1 | 19.3 | 20.5 | 21.8 |
| Total Cash, percent | .0 | .0 | .0 | .0 | .0 | .0 | .0 | .0 | .0 | .0 |
| Account Receivables | 233.5 | 381.8 | 859.9 | 299.7 | 427.9 | 459.9 | 488.8 | 519.5 | 552.2 | 586.9 |
| Account Receivables, % | 11 | 10.45 | 25.47 | 11.21 | 14.33 | 14.49 | 14.49 | 14.49 | 14.49 | 14.49 |
| Inventories | 152.7 | 158.5 | 289.3 | 412.8 | 377.7 | 305.8 | 325.1 | 345.5 | 367.2 | 390.3 |
| Inventories, % | 7.2 | 4.34 | 8.57 | 15.44 | 12.65 | 9.64 | 9.64 | 9.64 | 9.64 | 9.64 |
| Accounts Payable | 251.5 | 274.0 | 448.9 | 276.4 | 305.7 | 337.8 | 359.0 | 381.6 | 405.6 | 431.1 |
| Accounts Payable, % | 11.85 | 7.5 | 13.3 | 10.34 | 10.24 | 10.64 | 10.64 | 10.64 | 10.64 | 10.64 |
| Capital Expenditure | -650.5 | -778.5 | -1,050.9 | -1,178.2 | -1,090.9 | -1,038.8 | -1,104.1 | -1,173.5 | -1,247.3 | -1,325.8 |
| Capital Expenditure, % | -30.65 | -21.31 | -31.13 | -44.06 | -36.54 | -32.74 | -32.74 | -32.74 | -32.74 | -32.74 |
| Tax Rate, % | 15.19 | 15.19 | 15.19 | 15.19 | 15.19 | 15.19 | 15.19 | 15.19 | 15.19 | 15.19 |
| EBITAT | -81.2 | 873.1 | 806.0 | 611.9 | 657.3 | 516.8 | 549.3 | 583.8 | 620.6 | 659.6 |
| Depreciation | ||||||||||
| Changes in Account Receivables | ||||||||||
| Changes in Inventories | ||||||||||
| Changes in Accounts Payable | ||||||||||
| Capital Expenditure | ||||||||||
| UFCF | -475.1 | 379.0 | -218.0 | 204.5 | 42.1 | 60.8 | -38.8 | -41.2 | -43.8 | -46.6 |
| WACC, % | 5.11 | 5.57 | 5.58 | 5.64 | 5.59 | 5.5 | 5.5 | 5.5 | 5.5 | 5.5 |
| PV UFCF | ||||||||||
| SUM PV UFCF | -83.3 | |||||||||
| Long Term Growth Rate, % | 2.00 | |||||||||
| Free cash flow (T + 1) | -48 | |||||||||
| Terminal Value | -1,358 | |||||||||
| Present Terminal Value | -1,039 | |||||||||
| Enterprise Value | -1,123 | |||||||||
| Net Debt | 5,522 | |||||||||
| Equity Value | -6,645 | |||||||||
| Diluted Shares Outstanding, MM | 201 | |||||||||
| Equity Value Per Share | -33.01 |
What You Will Get
- Real OGE Financial Data: Pre-filled with OGE Energy Corp.'s historical and projected data for precise analysis.
- Fully Editable Template: Modify key inputs like revenue growth, WACC, and EBITDA % with ease.
- Automatic Calculations: See OGE Energy Corp.'s intrinsic value update instantly based on your changes.
- Professional Valuation Tool: Designed for investors, analysts, and consultants seeking accurate DCF results.
- User-Friendly Design: Simple structure and clear instructions for all experience levels.
Key Features
- Accurate OGE Financials: Gain access to reliable pre-loaded historical data and future forecasts.
- Adjustable Forecast Assumptions: Modify highlighted cells for metrics like WACC, growth rates, and profit margins.
- Real-Time Calculations: Automatic updates for DCF, Net Present Value (NPV), and cash flow assessments.
- Interactive Dashboard: User-friendly charts and summaries to help visualize your valuation outcomes.
- Designed for All Users: An intuitive layout tailored for investors, CFOs, and consultants alike.
How It Works
- Download: Obtain the pre-configured Excel file containing OGE Energy Corp.'s (OGE) financial information.
- Customize: Modify projections, such as revenue growth, EBITDA %, and WACC.
- Update Automatically: The intrinsic value and NPV calculations refresh in real-time.
- Test Scenarios: Generate various forecasts and analyze results instantly.
- Make Decisions: Leverage the valuation findings to inform your investment approach.
Why Choose OGE Energy Corp. (OGE) Calculator?
- Accuracy: Utilizes reliable OGE financial data for precise calculations.
- Flexibility: Allows users to easily adjust and experiment with various inputs.
- Time-Saving: Eliminate the need to create a DCF model from the ground up.
- Professional-Grade: Crafted with the expertise and standards expected by CFOs.
- User-Friendly: Intuitive design makes it accessible for all users, regardless of financial modeling skills.
Who Should Use This Product?
- Professional Investors: Construct comprehensive and trustworthy valuation models for analyzing OGE Energy Corp. (OGE) portfolios.
- Corporate Finance Teams: Evaluate valuation scenarios to inform strategic decisions within the company.
- Consultants and Advisors: Offer clients precise valuation insights for OGE Energy Corp. (OGE) stock.
- Students and Educators: Utilize real-world data for practicing and teaching financial modeling techniques.
- Energy Sector Enthusiasts: Gain insights into how energy companies like OGE Energy Corp. (OGE) are assessed in the market.
What the Template Contains
- Preloaded OGE Data: Historical and projected financial data, including revenue, EBIT, and capital expenditures.
- DCF and WACC Models: Professional-grade sheets for calculating intrinsic value and Weighted Average Cost of Capital.
- Editable Inputs: Yellow-highlighted cells for adjusting revenue growth, tax rates, and discount rates.
- Financial Statements: Comprehensive annual and quarterly financials for deeper analysis.
- Key Ratios: Profitability, leverage, and efficiency ratios to evaluate performance.
- Dashboard and Charts: Visual summaries of valuation outcomes and assumptions.
Disclaimer
All information, articles, and product details provided on this website are for general informational and educational purposes only. We do not claim any ownership over, nor do we intend to infringe upon, any trademarks, copyrights, logos, brand names, or other intellectual property mentioned or depicted on this site. Such intellectual property remains the property of its respective owners, and any references here are made solely for identification or informational purposes, without implying any affiliation, endorsement, or partnership.
We make no representations or warranties, express or implied, regarding the accuracy, completeness, or suitability of any content or products presented. Nothing on this website should be construed as legal, tax, investment, financial, medical, or other professional advice. In addition, no part of this site—including articles or product references—constitutes a solicitation, recommendation, endorsement, advertisement, or offer to buy or sell any securities, franchises, or other financial instruments, particularly in jurisdictions where such activity would be unlawful.
All content is of a general nature and may not address the specific circumstances of any individual or entity. It is not a substitute for professional advice or services. Any actions you take based on the information provided here are strictly at your own risk. You accept full responsibility for any decisions or outcomes arising from your use of this website and agree to release us from any liability in connection with your use of, or reliance upon, the content or products found herein.