
|
ProductPad Solutions Inc. (OPAD) DCF تقييم |
Fully Editable: Tailor To Your Needs In Excel Or Sheets
Professional Design: Trusted, Industry-Standard Templates
Investor-Approved Valuation Models
MAC/PC Compatible, Fully Unlocked
No Expertise Is Needed; Easy To Follow
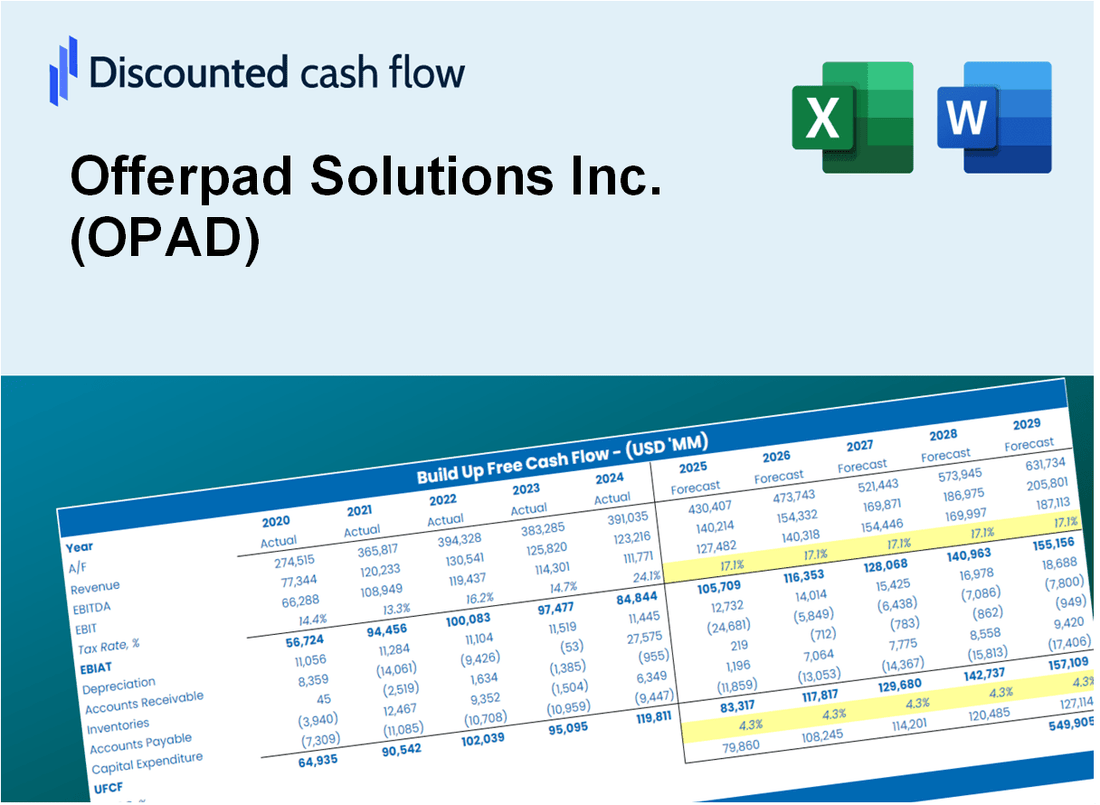
Offerpad Solutions Inc. (OPAD) Bundle
اكتشف الإمكانات الحقيقية لشركة عرض SolutionPad Solutions (OPAD) مع حاسبة DCF المتقدمة! تخصيص الافتراضات الأساسية ، واستكشاف السيناريوهات المختلفة ، وتقييم تأثيرات التعديلات على التقييم على ProductPad Solutions Inc. (OPAD) ، كل ذلك ضمن قالب Excel واحد.
Discounted Cash Flow (DCF) - (USD MM)
| Year | AY1 2020 |
AY2 2021 |
AY3 2022 |
AY4 2023 |
AY5 2024 |
FY1 2025 |
FY2 2026 |
FY3 2027 |
FY4 2028 |
FY5 2029 |
|---|---|---|---|---|---|---|---|---|---|---|
| Revenue | 1,064.3 | 2,070.4 | 3,952.3 | 1,314.4 | 918.8 | 1,122.3 | 1,370.9 | 1,674.6 | 2,045.5 | 2,498.5 |
| Revenue Growth, % | 0 | 94.54 | 90.89 | -66.74 | -30.1 | 22.15 | 22.15 | 22.15 | 22.15 | 22.15 |
| EBITDA | -12.5 | 23.0 | -101.2 | -97.5 | -42.8 | -33.0 | -40.3 | -49.2 | -60.1 | -73.5 |
| EBITDA, % | -1.17 | 1.11 | -2.56 | -7.42 | -4.66 | -2.94 | -2.94 | -2.94 | -2.94 | -2.94 |
| Depreciation | .4 | .5 | 1.0 | .7 | .6 | .5 | .6 | .7 | .9 | 1.1 |
| Depreciation, % | 0.04077962 | 0.02526026 | 0.02585827 | 0.05538598 | 0.06649841 | 0.04275651 | 0.04275651 | 0.04275651 | 0.04275651 | 0.04275651 |
| EBIT | -12.9 | 22.5 | -102.3 | -98.2 | -43.4 | -33.5 | -40.9 | -50.0 | -61.0 | -74.5 |
| EBIT, % | -1.21 | 1.09 | -2.59 | -7.47 | -4.73 | -2.98 | -2.98 | -2.98 | -2.98 | -2.98 |
| Total Cash | 43.9 | 169.8 | 97.2 | 76.0 | 43.0 | 56.7 | 69.2 | 84.6 | 103.3 | 126.2 |
| Total Cash, percent | .0 | .0 | .0 | .0 | .0 | .0 | .0 | .0 | .0 | .0 |
| Account Receivables | 2.3 | 6.2 | 2.4 | 9.9 | 3.8 | 3.9 | 4.8 | 5.9 | 7.2 | 8.7 |
| Account Receivables, % | 0.21696 | 0.29776 | 0.05945884 | 0.75585 | 0.4188 | 0.34977 | 0.34977 | 0.34977 | 0.34977 | 0.34977 |
| Inventories | 171.4 | 1,132.6 | 664.7 | 276.5 | 214.2 | 296.2 | 361.8 | 442.0 | 539.9 | 659.4 |
| Inventories, % | 16.1 | 54.7 | 16.82 | 21.04 | 23.31 | 26.39 | 26.39 | 26.39 | 26.39 | 26.39 |
| Accounts Payable | 2.1 | 6.4 | 4.6 | 4.9 | 1.9 | 2.7 | 3.3 | 4.1 | 5.0 | 6.1 |
| Accounts Payable, % | 0.20192 | 0.30906 | 0.11758 | 0.37629 | 0.20918 | 0.24281 | 0.24281 | 0.24281 | 0.24281 | 0.24281 |
| Capital Expenditure | -2.9 | -13.7 | -1.1 | -.1 | -5.4 | -3.5 | -4.3 | -5.2 | -6.4 | -7.8 |
| Capital Expenditure, % | -0.26854 | -0.66107 | -0.02707275 | -0.00966212 | -0.58858 | -0.31099 | -0.31099 | -0.31099 | -0.31099 | -0.31099 |
| Tax Rate, % | -0.04989699 | -0.04989699 | -0.04989699 | -0.04989699 | -0.04989699 | -0.04989699 | -0.04989699 | -0.04989699 | -0.04989699 | -0.04989699 |
| EBITAT | -13.0 | 21.9 | -102.5 | -98.3 | -43.5 | -33.3 | -40.7 | -49.7 | -60.7 | -74.1 |
| Depreciation | ||||||||||
| Changes in Account Receivables | ||||||||||
| Changes in Inventories | ||||||||||
| Changes in Accounts Payable | ||||||||||
| Capital Expenditure | ||||||||||
| UFCF | -187.0 | -952.1 | 367.4 | 283.2 | 17.1 | -117.6 | -110.2 | -134.7 | -164.5 | -200.9 |
| WACC, % | 9.65 | 9.52 | 9.65 | 9.65 | 9.65 | 9.62 | 9.62 | 9.62 | 9.62 | 9.62 |
| PV UFCF | ||||||||||
| SUM PV UFCF | -542.1 | |||||||||
| Long Term Growth Rate, % | 2.00 | |||||||||
| Free cash flow (T + 1) | -205 | |||||||||
| Terminal Value | -2,688 | |||||||||
| Present Terminal Value | -1,698 | |||||||||
| Enterprise Value | -2,240 | |||||||||
| Net Debt | 195 | |||||||||
| Equity Value | -2,435 | |||||||||
| Diluted Shares Outstanding, MM | 27 | |||||||||
| Equity Value Per Share | -88.84 |
What You Will Get
- Real OPAD Financials: Access to historical and projected data for precise valuation.
- Adjustable Inputs: Customize WACC, tax rates, revenue growth, and capital expenditures.
- Automatic Calculations: Intrinsic value and NPV are computed in real-time.
- Scenario Analysis: Evaluate various scenarios to assess Offerpad's future performance.
- Clear and Intuitive Design: Designed for professionals while remaining user-friendly for beginners.
Key Features
- Real-Time OPAD Data: Pre-loaded with Offerpad’s historical performance metrics and future outlook estimates.
- Customizable Input Parameters: Modify factors such as sales growth, profit margins, discount rates, tax implications, and capital investments.
- Adaptive Valuation Framework: Instant recalculations of Net Present Value (NPV) and intrinsic value based on your adjustments.
- Scenario Analysis: Develop various forecasting scenarios to evaluate different valuation possibilities.
- User-Centric Interface: Intuitive, organized, and crafted for both industry experts and newcomers.
How It Works
- Download: Get the pre-built Excel file featuring Offerpad Solutions Inc.'s (OPAD) financial data.
- Customize: Modify projections, including revenue growth, EBITDA %, and WACC as needed.
- Update Automatically: Watch as the intrinsic value and NPV calculations refresh in real-time.
- Test Scenarios: Generate various projections and evaluate outcomes immediately.
- Make Decisions: Leverage the valuation results to inform your investment choices.
Why Choose Offerpad Solutions Inc. (OPAD)?
- Streamlined Process: Simplify your home buying and selling experience with our efficient platform.
- Market Insights: Access accurate data and analytics to make informed real estate decisions.
- Flexible Options: Customize your transaction process to meet your unique needs and preferences.
- User-Friendly Interface: Intuitive design ensures a smooth experience for all users.
- Backed by Professionals: Our team of experts is dedicated to providing exceptional service and support.
Who Should Use Offerpad Solutions Inc. (OPAD)?
- Real Estate Investors: Develop comprehensive valuation models for property investments.
- Corporate Strategy Teams: Evaluate market trends to inform business decisions within the real estate sector.
- Consultants and Advisors: Deliver precise valuation assessments for Offerpad Solutions Inc. (OPAD) to clients.
- Students and Educators: Utilize real estate data to enhance learning in financial modeling and valuation.
- Market Analysts: Gain insights into how real estate technology companies like Offerpad Solutions Inc. (OPAD) are appraised in the industry.
What the Template Contains
- Operating and Balance Sheet Data: Pre-filled Offerpad Solutions Inc. (OPAD) historical data and forecasts, including revenue, EBITDA, EBIT, and capital expenditures.
- WACC Calculation: A dedicated sheet for Weighted Average Cost of Capital (WACC), including parameters like Beta, risk-free rate, and share price.
- DCF Valuation (Unlevered and Levered): Editable Discounted Cash Flow models showing intrinsic value with detailed calculations.
- Financial Statements: Pre-loaded financial statements (annual and quarterly) to support analysis.
- Key Ratios: Includes profitability, leverage, and efficiency ratios for Offerpad Solutions Inc. (OPAD).
- Dashboard and Charts: Visual summary of valuation outputs and assumptions to analyze results easily.
Disclaimer
All information, articles, and product details provided on this website are for general informational and educational purposes only. We do not claim any ownership over, nor do we intend to infringe upon, any trademarks, copyrights, logos, brand names, or other intellectual property mentioned or depicted on this site. Such intellectual property remains the property of its respective owners, and any references here are made solely for identification or informational purposes, without implying any affiliation, endorsement, or partnership.
We make no representations or warranties, express or implied, regarding the accuracy, completeness, or suitability of any content or products presented. Nothing on this website should be construed as legal, tax, investment, financial, medical, or other professional advice. In addition, no part of this site—including articles or product references—constitutes a solicitation, recommendation, endorsement, advertisement, or offer to buy or sell any securities, franchises, or other financial instruments, particularly in jurisdictions where such activity would be unlawful.
All content is of a general nature and may not address the specific circumstances of any individual or entity. It is not a substitute for professional advice or services. Any actions you take based on the information provided here are strictly at your own risk. You accept full responsibility for any decisions or outcomes arising from your use of this website and agree to release us from any liability in connection with your use of, or reliance upon, the content or products found herein.