
|
Opendoor Technologies Inc. (Open) DCF تقييم |
Fully Editable: Tailor To Your Needs In Excel Or Sheets
Professional Design: Trusted, Industry-Standard Templates
Investor-Approved Valuation Models
MAC/PC Compatible, Fully Unlocked
No Expertise Is Needed; Easy To Follow
Opendoor Technologies Inc. (OPEN) Bundle
اكتشف القيمة الحقيقية لشركة Opendoor Technologies Inc. (مفتوحة) مع حاسبة DCF المتقدمة! اضبط الافتراضات الرئيسية واستكشاف السيناريوهات المختلفة وتقييم كيفية تأثير التغييرات المختلفة على تقييم Opendoor - وكلها مريحة في قالب Excel واحد.
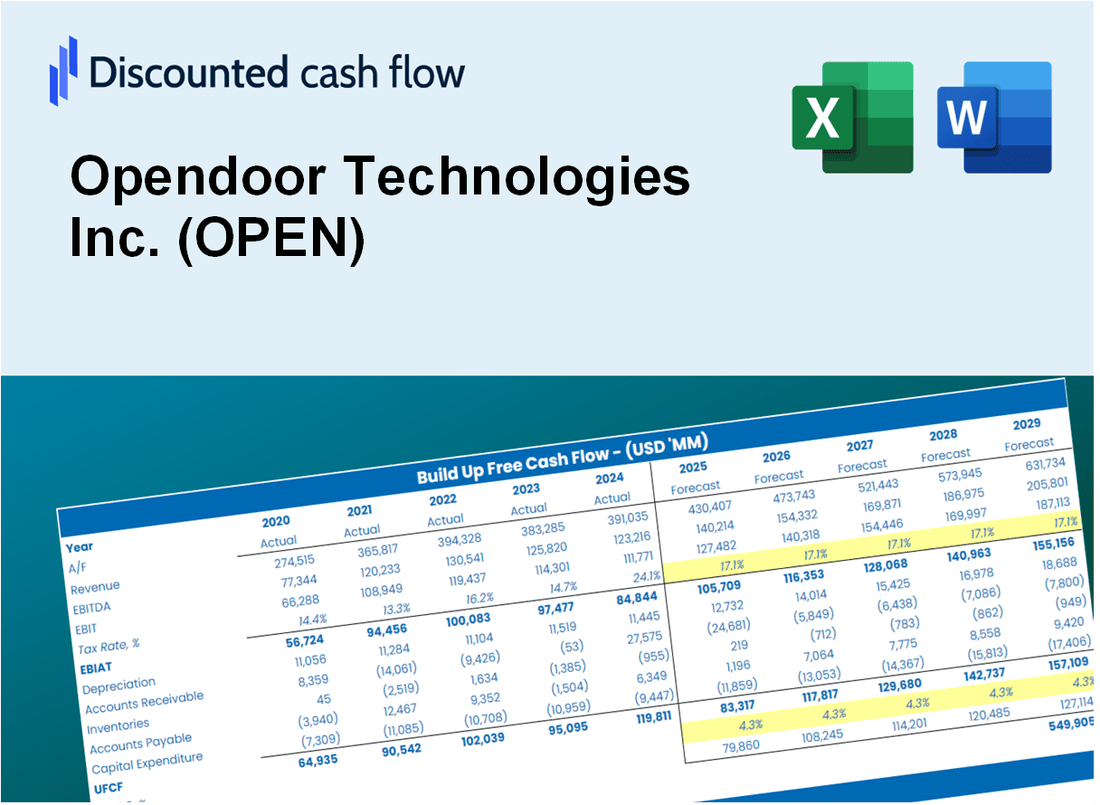
Discounted Cash Flow (DCF) - (USD MM)
| Year | AY1 2020 |
AY2 2021 |
AY3 2022 |
AY4 2023 |
AY5 2024 |
FY1 2025 |
FY2 2026 |
FY3 2027 |
FY4 2028 |
FY5 2029 |
|---|---|---|---|---|---|---|---|---|---|---|
| Revenue | 2,583.1 | 8,021.0 | 15,567.0 | 6,946.0 | 5,153.0 | 6,607.2 | 8,471.9 | 10,862.7 | 13,928.3 | 17,859.1 |
| Revenue Growth, % | 0 | 210.52 | 94.08 | -55.38 | -25.81 | 28.22 | 28.22 | 28.22 | 28.22 | 28.22 |
| EBITDA | -121.0 | -509.0 | -761.0 | -290.0 | -243.0 | -327.8 | -420.4 | -539.0 | -691.1 | -886.1 |
| EBITDA, % | -4.68 | -6.35 | -4.89 | -4.18 | -4.72 | -4.96 | -4.96 | -4.96 | -4.96 | -4.96 |
| Depreciation | 63.0 | 55.0 | 90.0 | 72.0 | 53.0 | 76.2 | 97.7 | 125.3 | 160.7 | 206.0 |
| Depreciation, % | 2.44 | 0.6857 | 0.57815 | 1.04 | 1.03 | 1.15 | 1.15 | 1.15 | 1.15 | 1.15 |
| EBIT | -184.0 | -564.0 | -851.0 | -362.0 | -296.0 | -404.1 | -518.1 | -664.3 | -851.8 | -1,092.2 |
| EBIT, % | -7.12 | -7.03 | -5.47 | -5.21 | -5.74 | -6.12 | -6.12 | -6.12 | -6.12 | -6.12 |
| Total Cash | 1,460.3 | 2,215.0 | 1,281.0 | 1,068.0 | 679.0 | 1,598.0 | 2,049.0 | 2,627.2 | 3,368.7 | 4,319.4 |
| Total Cash, percent | .0 | .0 | .0 | .0 | .0 | .0 | .0 | .0 | .0 | .0 |
| Account Receivables | 1.0 | 84.0 | 30.0 | 9.0 | 6.0 | 20.1 | 25.8 | 33.1 | 42.5 | 54.5 |
| Account Receivables, % | 0.03871286 | 1.05 | 0.19272 | 0.12957 | 0.11644 | 0.30494 | 0.30494 | 0.30494 | 0.30494 | 0.30494 |
| Inventories | 465.9 | 6,096.0 | 4,460.0 | 1,775.0 | 2,159.0 | 2,512.6 | 3,221.7 | 4,130.9 | 5,296.7 | 6,791.5 |
| Inventories, % | 18.04 | 76 | 28.65 | 25.55 | 41.9 | 38.03 | 38.03 | 38.03 | 38.03 | 38.03 |
| Accounts Payable | 3.0 | 3.0 | 5.0 | 2.0 | 9.0 | 5.1 | 6.6 | 8.5 | 10.8 | 13.9 |
| Accounts Payable, % | 0.11614 | 0.03740182 | 0.03211923 | 0.02879355 | 0.17466 | 0.07782174 | 0.07782174 | 0.07782174 | 0.07782174 | 0.07782174 |
| Capital Expenditure | -17.0 | -33.0 | -37.0 | -37.0 | -25.0 | -30.7 | -39.4 | -50.5 | -64.8 | -83.0 |
| Capital Expenditure, % | -0.65812 | -0.41142 | -0.23768 | -0.53268 | -0.48515 | -0.46501 | -0.46501 | -0.46501 | -0.46501 | -0.46501 |
| Tax Rate, % | -0.25575 | -0.25575 | -0.25575 | -0.25575 | -0.25575 | -0.25575 | -0.25575 | -0.25575 | -0.25575 | -0.25575 |
| EBITAT | -162.4 | -564.9 | -852.3 | -363.3 | -296.8 | -394.6 | -505.9 | -648.7 | -831.8 | -1,066.5 |
| Depreciation | ||||||||||
| Changes in Account Receivables | ||||||||||
| Changes in Inventories | ||||||||||
| Changes in Accounts Payable | ||||||||||
| Capital Expenditure | ||||||||||
| UFCF | -580.3 | -6,255.9 | 892.7 | 2,374.7 | -642.8 | -720.7 | -1,160.9 | -1,488.5 | -1,908.6 | -2,447.2 |
| WACC, % | 15.66 | 15.87 | 15.87 | 15.87 | 15.87 | 15.83 | 15.83 | 15.83 | 15.83 | 15.83 |
| PV UFCF | ||||||||||
| SUM PV UFCF | -4,679.1 | |||||||||
| Long Term Growth Rate, % | 2.00 | |||||||||
| Free cash flow (T + 1) | -2,496 | |||||||||
| Terminal Value | -18,047 | |||||||||
| Present Terminal Value | -8,655 | |||||||||
| Enterprise Value | -13,334 | |||||||||
| Net Debt | 1,646 | |||||||||
| Equity Value | -14,980 | |||||||||
| Diluted Shares Outstanding, MM | 699 | |||||||||
| Equity Value Per Share | -21.42 |
What You Will Gain
- Comprehensive Financial Model: Leverage Opendoor’s actual metrics for accurate DCF valuation.
- Complete Forecast Flexibility: Modify revenue growth, profit margins, WACC, and other essential parameters.
- Real-Time Calculations: Instant updates provide immediate feedback as you adjust inputs.
- Professional-Grade Template: A polished Excel file crafted for high-quality valuation analysis.
- Adaptable and Reusable: Designed for versatility, facilitating repeated application for in-depth forecasts.
Key Features
- Comprehensive DCF Calculator: Offers both unlevered and levered DCF valuation models tailored for Opendoor Technologies Inc. (OPEN).
- WACC Calculator: Features a pre-built Weighted Average Cost of Capital sheet with adjustable parameters.
- Customizable Forecast Assumptions: Easily alter growth rates, capital expenditures, and discount rates.
- Integrated Financial Ratios: Evaluate profitability, leverage, and efficiency ratios specifically for Opendoor Technologies Inc. (OPEN).
- Interactive Dashboard and Charts: Visual representations that condense essential valuation metrics for straightforward analysis.
How It Works
- Download the Template: Gain immediate access to the Excel-based OPEN DCF Calculator.
- Input Your Assumptions: Modify the yellow-highlighted cells to set growth rates, WACC, margins, and other variables.
- Instant Calculations: The model automatically recalculates Opendoor’s intrinsic value.
- Test Scenarios: Experiment with various assumptions to assess potential changes in valuation.
- Analyze and Decide: Leverage the results to inform your investment or financial strategy.
Why Choose This Calculator for Opendoor Technologies Inc. (OPEN)?
- All-in-One Tool: Offers DCF, WACC, and financial ratio analyses tailored for Opendoor.
- Flexible Inputs: Modify the highlighted cells to explore different financial scenarios.
- In-Depth Analysis: Automatically computes Opendoor’s intrinsic value and Net Present Value.
- Preloaded Information: Access to historical and projected data for precise calculations.
- Expert-Level Quality: Perfect for financial analysts, investors, and business strategists.
Who Should Use Opendoor Technologies Inc. (OPEN)?
- Real Estate Investors: Leverage data-driven insights to make informed property investment decisions.
- Market Analysts: Utilize comprehensive market analysis tools to streamline your research process.
- Realtors: Customize reports and presentations to better serve your clients’ needs.
- Homebuyers and Sellers: Gain a deeper understanding of the market dynamics to navigate transactions confidently.
- Educators and Students: Incorporate real estate technology concepts into your curriculum for enhanced learning.
What the Template Contains
- Historical Data: Includes Opendoor Technologies Inc.’s (OPEN) past financials and baseline forecasts.
- DCF and Levered DCF Models: Detailed templates to calculate Opendoor Technologies Inc.’s (OPEN) intrinsic value.
- WACC Sheet: Pre-built calculations for Weighted Average Cost of Capital.
- Editable Inputs: Modify key drivers like growth rates, EBITDA %, and CAPEX assumptions.
- Quarterly and Annual Statements: A complete breakdown of Opendoor Technologies Inc.’s (OPEN) financials.
- Interactive Dashboard: Visualize valuation results and projections dynamically.
Disclaimer
All information, articles, and product details provided on this website are for general informational and educational purposes only. We do not claim any ownership over, nor do we intend to infringe upon, any trademarks, copyrights, logos, brand names, or other intellectual property mentioned or depicted on this site. Such intellectual property remains the property of its respective owners, and any references here are made solely for identification or informational purposes, without implying any affiliation, endorsement, or partnership.
We make no representations or warranties, express or implied, regarding the accuracy, completeness, or suitability of any content or products presented. Nothing on this website should be construed as legal, tax, investment, financial, medical, or other professional advice. In addition, no part of this site—including articles or product references—constitutes a solicitation, recommendation, endorsement, advertisement, or offer to buy or sell any securities, franchises, or other financial instruments, particularly in jurisdictions where such activity would be unlawful.
All content is of a general nature and may not address the specific circumstances of any individual or entity. It is not a substitute for professional advice or services. Any actions you take based on the information provided here are strictly at your own risk. You accept full responsibility for any decisions or outcomes arising from your use of this website and agree to release us from any liability in connection with your use of, or reliance upon, the content or products found herein.