
|
خصائص المكتب دخل ثقة (OPI) DCF تقييم |
Fully Editable: Tailor To Your Needs In Excel Or Sheets
Professional Design: Trusted, Industry-Standard Templates
Investor-Approved Valuation Models
MAC/PC Compatible, Fully Unlocked
No Expertise Is Needed; Easy To Follow
Office Properties Income Trust (OPI) Bundle
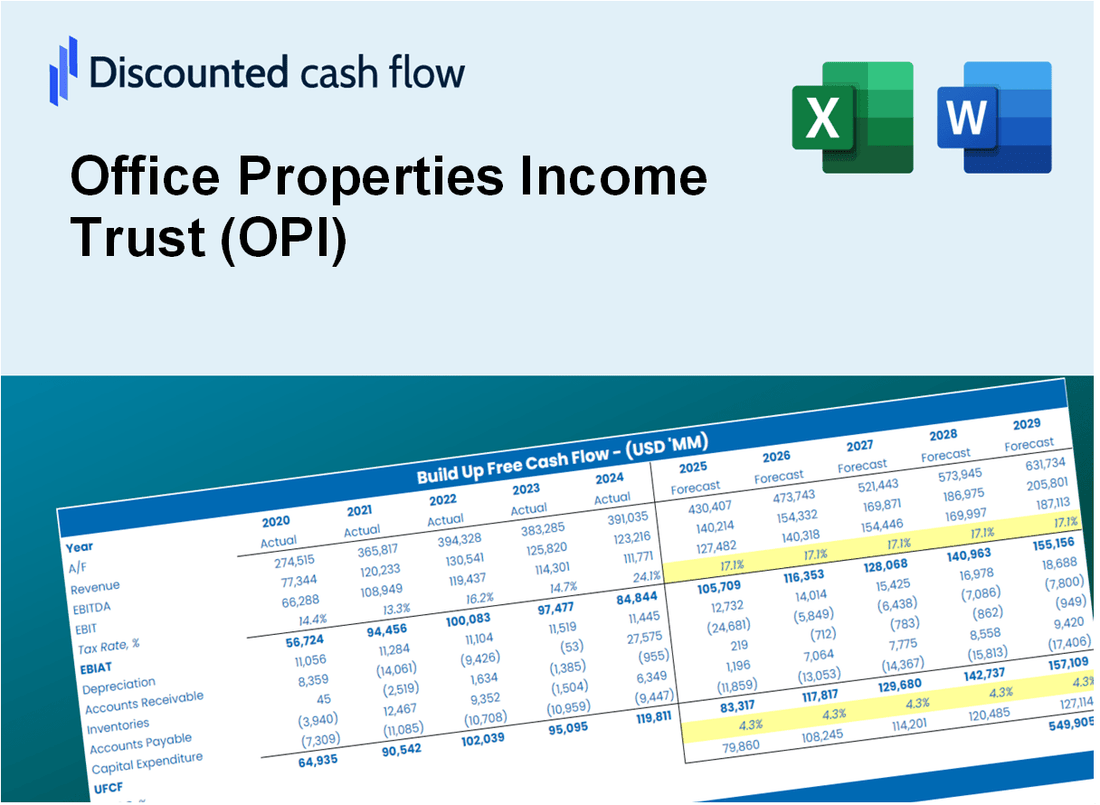
تُمكّنك حاسبة DCF الخاصة بنا (OPI) DCF من تقييم تقييم ثقة الدخل في خصائص المكتب باستخدام البيانات المالية في العالم الحقيقي ، مما يوفر مرونة كاملة لتعديل جميع المعلمات الأساسية للتوقعات المحسنة.
Discounted Cash Flow (DCF) - (USD MM)
| Year | AY1 2020 |
AY2 2021 |
AY3 2022 |
AY4 2023 |
AY5 2024 |
FY1 2025 |
FY2 2026 |
FY3 2027 |
FY4 2028 |
FY5 2029 |
|---|---|---|---|---|---|---|---|---|---|---|
| Revenue | 587.9 | 576.5 | 554.3 | 533.6 | 502.0 | 482.6 | 463.9 | 446.0 | 428.8 | 412.2 |
| Revenue Growth, % | 0 | -1.95 | -3.85 | -3.74 | -5.92 | -3.86 | -3.86 | -3.86 | -3.86 | -3.86 |
| EBITDA | 368.1 | 348.5 | 334.1 | 302.3 | 285.6 | 286.6 | 275.5 | 264.9 | 254.6 | 244.8 |
| EBITDA, % | 62.61 | 60.44 | 60.28 | 56.67 | 56.9 | 59.38 | 59.38 | 59.38 | 59.38 | 59.38 |
| Depreciation | 476.2 | 475.5 | 444.0 | 200.3 | 194.7 | 308.8 | 296.8 | 285.4 | 274.3 | 263.7 |
| Depreciation, % | 81 | 82.47 | 80.11 | 37.53 | 38.79 | 63.98 | 63.98 | 63.98 | 63.98 | 63.98 |
| EBIT | -108.1 | -127.0 | -109.9 | 102.1 | 90.9 | -22.2 | -21.3 | -20.5 | -19.7 | -19.0 |
| EBIT, % | -18.39 | -22.03 | -19.83 | 19.13 | 18.1 | -4.6 | -4.6 | -4.6 | -4.6 | -4.6 |
| Total Cash | 42.0 | 83.0 | 12.2 | 12.3 | 261.3 | 75.4 | 72.5 | 69.7 | 67.0 | 64.4 |
| Total Cash, percent | .0 | .0 | .0 | .0 | .0 | .0 | .0 | .0 | .0 | .0 |
| Account Receivables | 101.8 | 112.9 | 105.6 | 133.3 | 155.7 | 108.0 | 103.9 | 99.9 | 96.0 | 92.3 |
| Account Receivables, % | 17.31 | 19.58 | 19.06 | 24.98 | 31.01 | 22.39 | 22.39 | 22.39 | 22.39 | 22.39 |
| Inventories | 75.2 | 26.6 | 2.5 | .0 | .0 | 17.2 | 16.6 | 15.9 | 15.3 | 14.7 |
| Inventories, % | 12.79 | 4.61 | 0.45393 | 0 | 0 | 3.57 | 3.57 | 3.57 | 3.57 | 3.57 |
| Accounts Payable | 116.3 | 142.6 | 140.2 | 140.2 | 118.7 | 115.6 | 111.1 | 106.8 | 102.7 | 98.7 |
| Accounts Payable, % | 19.78 | 24.74 | 25.29 | 26.27 | 23.64 | 23.94 | 23.94 | 23.94 | 23.94 | 23.94 |
| Capital Expenditure | -81.8 | -100.1 | -204.1 | .0 | .0 | -65.7 | -63.2 | -60.7 | -58.4 | -56.1 |
| Capital Expenditure, % | -13.91 | -17.37 | -36.82 | 0 | 0 | -13.62 | -13.62 | -13.62 | -13.62 | -13.62 |
| Tax Rate, % | -0.71108 | -0.71108 | -0.71108 | -0.71108 | -0.71108 | -0.71108 | -0.71108 | -0.71108 | -0.71108 | -0.71108 |
| EBITAT | -87.5 | -132.9 | -122.6 | 151.2 | 91.5 | -21.4 | -20.5 | -19.7 | -19.0 | -18.2 |
| Depreciation | ||||||||||
| Changes in Account Receivables | ||||||||||
| Changes in Inventories | ||||||||||
| Changes in Accounts Payable | ||||||||||
| Capital Expenditure | ||||||||||
| UFCF | 246.3 | 306.2 | 146.2 | 326.4 | 242.4 | 248.9 | 213.5 | 205.2 | 197.3 | 189.7 |
| WACC, % | 5.24 | 6.46 | 6.46 | 6.46 | 6.46 | 6.21 | 6.21 | 6.21 | 6.21 | 6.21 |
| PV UFCF | ||||||||||
| SUM PV UFCF | 890.3 | |||||||||
| Long Term Growth Rate, % | 2.00 | |||||||||
| Free cash flow (T + 1) | 193 | |||||||||
| Terminal Value | 4,592 | |||||||||
| Present Terminal Value | 3,397 | |||||||||
| Enterprise Value | 4,288 | |||||||||
| Net Debt | 2,283 | |||||||||
| Equity Value | 2,005 | |||||||||
| Diluted Shares Outstanding, MM | 52 | |||||||||
| Equity Value Per Share | 38.70 |
What You Will Receive
- Pre-Filled Financial Model: Office Properties Income Trust’s (OPI) actual data facilitates accurate DCF valuation.
- Comprehensive Forecast Control: Modify revenue growth, margins, WACC, and other essential drivers.
- Real-Time Calculations: Automatic updates provide immediate results as you make adjustments.
- Professional-Grade Template: A polished Excel file crafted for high-quality valuation.
- Adaptable and Reusable: Designed for versatility, allowing for repeated use in detailed forecasting.
Key Features
- Pre-Loaded Data: Office Properties Income Trust’s historical financial statements and pre-filled forecasts.
- Fully Adjustable Inputs: Edit WACC, tax rates, revenue growth, and EBITDA margins.
- Instant Results: See Office Properties Income Trust’s intrinsic value recalculate in real time.
- Clear Visual Outputs: Dashboard charts display valuation results and key metrics.
- Built for Accuracy: A professional tool for analysts, investors, and finance experts.
How It Works
- 1. Access the Template: Download and open the Excel file containing Office Properties Income Trust’s (OPI) preloaded data.
- 2. Modify Assumptions: Adjust essential inputs such as occupancy rates, rental growth, and operating expenses.
- 3. Analyze Results Instantly: The DCF model automatically computes intrinsic value and NPV based on your inputs.
- 4. Explore Scenarios: Evaluate various forecasts to assess different valuation possibilities.
- 5. Present with Assurance: Deliver professional valuation insights to bolster your investment decisions.
Why Choose This Calculator for Office Properties Income Trust (OPI)?
- Accurate Data: Current Office Properties Income Trust (OPI) financials provide dependable valuation insights.
- Customizable: Tailor essential parameters like growth rates, WACC, and tax rates to align with your forecasts.
- Time-Saving: Ready-made calculations save you the hassle of starting from scratch.
- Professional-Grade Tool: Crafted for investors, analysts, and real estate consultants.
- User-Friendly: Streamlined design and guided instructions make it accessible for all users.
Who Should Use This Product?
- Investors: Accurately estimate Office Properties Income Trust’s (OPI) fair value before making investment decisions.
- CFOs: Utilize a professional-grade DCF model for financial reporting and analysis specific to OPI.
- Consultants: Quickly customize the template for valuation reports tailored to OPI clients.
- Entrepreneurs: Gain insights into financial modeling practices employed by real estate investment trusts.
- Educators: Use it as a teaching tool to demonstrate valuation methodologies within the real estate sector.
What the Template Contains
- Preloaded OPI Data: Historical and projected financial data, including revenue, EBIT, and capital expenditures.
- DCF and WACC Models: Professional-grade sheets for calculating intrinsic value and Weighted Average Cost of Capital.
- Editable Inputs: Yellow-highlighted cells for adjusting revenue growth, tax rates, and discount rates.
- Financial Statements: Comprehensive annual and quarterly financials for deeper analysis.
- Key Ratios: Profitability, leverage, and efficiency ratios to evaluate performance.
- Dashboard and Charts: Visual summaries of valuation outcomes and assumptions.
Disclaimer
All information, articles, and product details provided on this website are for general informational and educational purposes only. We do not claim any ownership over, nor do we intend to infringe upon, any trademarks, copyrights, logos, brand names, or other intellectual property mentioned or depicted on this site. Such intellectual property remains the property of its respective owners, and any references here are made solely for identification or informational purposes, without implying any affiliation, endorsement, or partnership.
We make no representations or warranties, express or implied, regarding the accuracy, completeness, or suitability of any content or products presented. Nothing on this website should be construed as legal, tax, investment, financial, medical, or other professional advice. In addition, no part of this site—including articles or product references—constitutes a solicitation, recommendation, endorsement, advertisement, or offer to buy or sell any securities, franchises, or other financial instruments, particularly in jurisdictions where such activity would be unlawful.
All content is of a general nature and may not address the specific circumstances of any individual or entity. It is not a substitute for professional advice or services. Any actions you take based on the information provided here are strictly at your own risk. You accept full responsibility for any decisions or outcomes arising from your use of this website and agree to release us from any liability in connection with your use of, or reliance upon, the content or products found herein.