
|
Onepan Inc. (OSPN) تقييم DCF |
Fully Editable: Tailor To Your Needs In Excel Or Sheets
Professional Design: Trusted, Industry-Standard Templates
Investor-Approved Valuation Models
MAC/PC Compatible, Fully Unlocked
No Expertise Is Needed; Easy To Follow
OneSpan Inc. (OSPN) Bundle
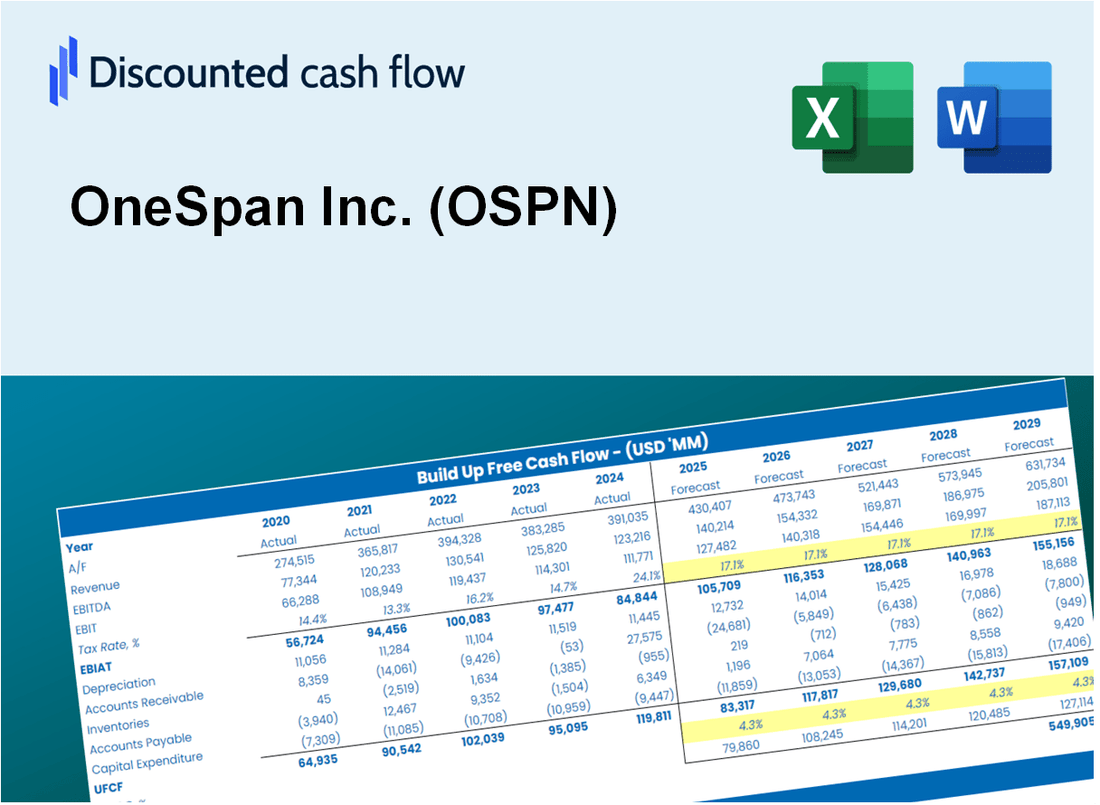
اكتساب نظرة ثاقبة على تحليل التقييم الخاص بك Thopanpan Inc. (OSPN) باستخدام حاسبة DCF المتطورة لدينا! يأتي قالب Excel هذا مسبقًا مع بيانات OSPN الفعلية ، مما يتيح لك ضبط التوقعات والافتراضات لحساب القيمة الجوهرية لـ Onepan Inc. بدقة.
Discounted Cash Flow (DCF) - (USD MM)
| Year | AY1 2020 |
AY2 2021 |
AY3 2022 |
AY4 2023 |
AY5 2024 |
FY1 2025 |
FY2 2026 |
FY3 2027 |
FY4 2028 |
FY5 2029 |
|---|---|---|---|---|---|---|---|---|---|---|
| Revenue | 215.7 | 214.5 | 219.0 | 235.1 | 243.2 | 250.7 | 258.4 | 266.4 | 274.6 | 283.1 |
| Revenue Growth, % | 0 | -0.56099 | 2.11 | 7.35 | 3.43 | 3.08 | 3.08 | 3.08 | 3.08 | 3.08 |
| EBITDA | 7.6 | -17.2 | -6.7 | -5.1 | 57.6 | 7.0 | 7.2 | 7.4 | 7.7 | 7.9 |
| EBITDA, % | 3.55 | -8.02 | -3.08 | -2.16 | 23.69 | 2.8 | 2.8 | 2.8 | 2.8 | 2.8 |
| Depreciation | 12.9 | 10.5 | 9.5 | 6.5 | 8.4 | 10.7 | 11.1 | 11.4 | 11.7 | 12.1 |
| Depreciation, % | 5.98 | 4.89 | 4.32 | 2.76 | 3.44 | 4.28 | 4.28 | 4.28 | 4.28 | 4.28 |
| EBIT | -5.3 | -27.7 | -16.2 | -11.6 | 49.2 | -3.7 | -3.8 | -3.9 | -4.1 | -4.2 |
| EBIT, % | -2.44 | -12.91 | -7.4 | -4.92 | 20.25 | -1.48 | -1.48 | -1.48 | -1.48 | -1.48 |
| Total Cash | 115.3 | 98.5 | 98.8 | 42.5 | 83.2 | 98.6 | 101.7 | 104.8 | 108.1 | 111.4 |
| Total Cash, percent | .0 | .0 | .0 | .0 | .0 | .0 | .0 | .0 | .0 | .0 |
| Account Receivables | 64.7 | 61.3 | 69.7 | 69.5 | 64.9 | 73.5 | 75.8 | 78.1 | 80.5 | 83.0 |
| Account Receivables, % | 30.01 | 28.58 | 31.8 | 29.57 | 26.69 | 29.33 | 29.33 | 29.33 | 29.33 | 29.33 |
| Inventories | 13.1 | 10.3 | 12.1 | 15.6 | 10.8 | 13.8 | 14.2 | 14.6 | 15.1 | 15.5 |
| Inventories, % | 6.07 | 4.82 | 5.5 | 6.62 | 4.44 | 5.49 | 5.49 | 5.49 | 5.49 | 5.49 |
| Accounts Payable | 5.7 | 8.2 | 17.4 | 17.5 | 13.3 | 13.7 | 14.1 | 14.5 | 15.0 | 15.4 |
| Accounts Payable, % | 2.64 | 3.83 | 7.93 | 7.42 | 5.47 | 5.46 | 5.46 | 5.46 | 5.46 | 5.46 |
| Capital Expenditure | -3.1 | -2.2 | -5.0 | -12.5 | -9.2 | -7.0 | -7.2 | -7.4 | -7.6 | -7.9 |
| Capital Expenditure, % | -1.44 | -1.03 | -2.29 | -5.34 | -3.8 | -2.78 | -2.78 | -2.78 | -2.78 | -2.78 |
| Tax Rate, % | -22.79 | -22.79 | -22.79 | -22.79 | -22.79 | -22.79 | -22.79 | -22.79 | -22.79 | -22.79 |
| EBITAT | -8.4 | -32.4 | -20.0 | -12.6 | 60.5 | -3.7 | -3.8 | -3.9 | -4.1 | -4.2 |
| Depreciation | ||||||||||
| Changes in Account Receivables | ||||||||||
| Changes in Inventories | ||||||||||
| Changes in Accounts Payable | ||||||||||
| Capital Expenditure | ||||||||||
| UFCF | -70.7 | -15.4 | -16.5 | -22.0 | 64.8 | -11.2 | -2.2 | -2.3 | -2.4 | -2.4 |
| WACC, % | 10.75 | 10.75 | 10.75 | 10.75 | 10.75 | 10.75 | 10.75 | 10.75 | 10.75 | 10.75 |
| PV UFCF | ||||||||||
| SUM PV UFCF | -16.6 | |||||||||
| Long Term Growth Rate, % | 2.00 | |||||||||
| Free cash flow (T + 1) | -2 | |||||||||
| Terminal Value | -28 | |||||||||
| Present Terminal Value | -17 | |||||||||
| Enterprise Value | -34 | |||||||||
| Net Debt | -74 | |||||||||
| Equity Value | 40 | |||||||||
| Diluted Shares Outstanding, MM | 39 | |||||||||
| Equity Value Per Share | 1.03 |
What You Will Get
- Pre-Filled Financial Model: OneSpan Inc.'s (OSPN) actual data facilitates accurate DCF valuation.
- Full Forecast Control: Modify revenue growth, margins, WACC, and other essential drivers.
- Instant Calculations: Automatic updates provide immediate results as you make adjustments.
- Investor-Ready Template: A polished Excel file crafted for professional-level valuation.
- Customizable and Reusable: Designed for flexibility, enabling repeated use for comprehensive forecasts.
Key Features
- Accurate OneSpan Financials: Gain access to reliable pre-loaded historical data and future forecasts.
- Adjustable Forecast Parameters: Modify highlighted cells for key metrics like WACC, growth rates, and profit margins.
- Real-Time Calculations: Automatic updates for DCF, Net Present Value (NPV), and cash flow assessments.
- Interactive Dashboard: User-friendly charts and summaries to effectively visualize your valuation outcomes.
- Designed for All Users: An intuitive layout catering to investors, CFOs, and consultants, regardless of experience level.
How It Works
- Step 1: Download the Excel file for OneSpan Inc. (OSPN).
- Step 2: Review OneSpan’s pre-filled financial data and projections.
- Step 3: Adjust key inputs such as revenue growth, WACC, and tax rates (highlighted cells).
- Step 4: Observe the DCF model update in real-time as you modify your assumptions.
- Step 5: Examine the outputs and leverage the results for your investment strategies.
Why Choose This Calculator for OneSpan Inc. (OSPN)?
- User-Friendly Interface: Perfectly tailored for both novices and seasoned professionals.
- Customizable Inputs: Adjust parameters effortlessly to suit your financial analysis.
- Real-Time Feedback: Monitor immediate changes to OneSpan’s valuation as you modify inputs.
- Preloaded Data: Comes equipped with OneSpan’s latest financial information for swift evaluations.
- Relied Upon by Experts: Favored by analysts and investors for making well-informed choices.
Who Should Use This Product?
- Individual Investors: Make informed decisions about buying or selling OneSpan Inc. (OSPN) stock.
- Financial Analysts: Streamline valuation processes with ready-to-use financial models specific to OneSpan Inc. (OSPN).
- Consultants: Deliver professional valuation insights on OneSpan Inc. (OSPN) to clients quickly and accurately.
- Business Owners: Understand how companies like OneSpan Inc. (OSPN) are valued to guide your own strategy.
- Finance Students: Learn valuation techniques using real-world data and scenarios related to OneSpan Inc. (OSPN).
What the Template Contains
- Pre-Filled Data: Includes OneSpan Inc.'s historical financials and forecasts.
- Discounted Cash Flow Model: Editable DCF valuation model with automatic calculations.
- Weighted Average Cost of Capital (WACC): A dedicated sheet for calculating WACC based on custom inputs.
- Key Financial Ratios: Analyze OneSpan Inc.'s profitability, efficiency, and leverage.
- Customizable Inputs: Edit revenue growth, margins, and tax rates with ease.
- Clear Dashboard: Charts and tables summarizing key valuation results.
Disclaimer
All information, articles, and product details provided on this website are for general informational and educational purposes only. We do not claim any ownership over, nor do we intend to infringe upon, any trademarks, copyrights, logos, brand names, or other intellectual property mentioned or depicted on this site. Such intellectual property remains the property of its respective owners, and any references here are made solely for identification or informational purposes, without implying any affiliation, endorsement, or partnership.
We make no representations or warranties, express or implied, regarding the accuracy, completeness, or suitability of any content or products presented. Nothing on this website should be construed as legal, tax, investment, financial, medical, or other professional advice. In addition, no part of this site—including articles or product references—constitutes a solicitation, recommendation, endorsement, advertisement, or offer to buy or sell any securities, franchises, or other financial instruments, particularly in jurisdictions where such activity would be unlawful.
All content is of a general nature and may not address the specific circumstances of any individual or entity. It is not a substitute for professional advice or services. Any actions you take based on the information provided here are strictly at your own risk. You accept full responsibility for any decisions or outcomes arising from your use of this website and agree to release us from any liability in connection with your use of, or reliance upon, the content or products found herein.