
|
Paramount Global (Paraa) DCF تقييم |
Fully Editable: Tailor To Your Needs In Excel Or Sheets
Professional Design: Trusted, Industry-Standard Templates
Investor-Approved Valuation Models
MAC/PC Compatible, Fully Unlocked
No Expertise Is Needed; Easy To Follow
Paramount Global (PARAA) Bundle
اكتشف القيمة الحقيقية لـ Paramount Global (Paraa) مع حاسبة DCF المتقدمة! اضبط الافتراضات الرئيسية واستكشاف السيناريوهات المختلفة وتقييم كيفية تأثير التغييرات على تقييم Paramount Global (Paraa) - كل ذلك ضمن قالب Excel واحد مناسب.
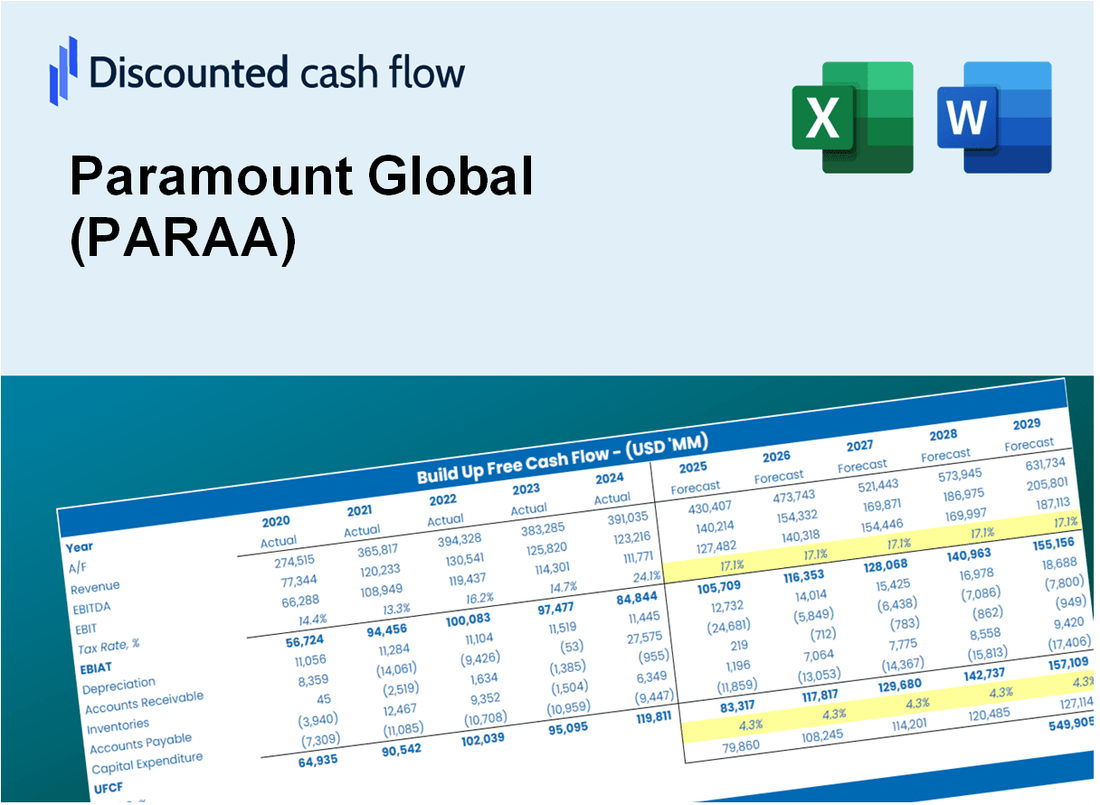
Discounted Cash Flow (DCF) - (USD MM)
| Year | AY1 2020 |
AY2 2021 |
AY3 2022 |
AY4 2023 |
AY5 2024 |
FY1 2025 |
FY2 2026 |
FY3 2027 |
FY4 2028 |
FY5 2029 |
|---|---|---|---|---|---|---|---|---|---|---|
| Revenue | 25,285.0 | 28,586.0 | 30,154.0 | 29,652.0 | 29,213.0 | 30,337.3 | 31,505.0 | 32,717.5 | 33,976.7 | 35,284.4 |
| Revenue Growth, % | 0 | 13.06 | 5.49 | -1.66 | -1.48 | 3.85 | 3.85 | 3.85 | 3.85 | 3.85 |
| EBITDA | 15,616.0 | 6,582.0 | 2,602.0 | 85.0 | -4,925.0 | 4,662.4 | 4,841.8 | 5,028.2 | 5,221.7 | 5,422.6 |
| EBITDA, % | 61.76 | 23.03 | 8.63 | 0.28666 | -16.86 | 15.37 | 15.37 | 15.37 | 15.37 | 15.37 |
| Depreciation | 11,438.0 | 390.0 | 405.0 | 418.0 | 392.0 | 3,075.9 | 3,194.3 | 3,317.2 | 3,444.9 | 3,577.5 |
| Depreciation, % | 45.24 | 1.36 | 1.34 | 1.41 | 1.34 | 10.14 | 10.14 | 10.14 | 10.14 | 10.14 |
| EBIT | 4,178.0 | 6,192.0 | 2,197.0 | -333.0 | -5,317.0 | 1,586.4 | 1,647.5 | 1,710.9 | 1,776.8 | 1,845.1 |
| EBIT, % | 16.52 | 21.66 | 7.29 | -1.12 | -18.2 | 5.23 | 5.23 | 5.23 | 5.23 | 5.23 |
| Total Cash | 2,984.0 | 6,267.0 | 2,885.0 | 2,460.0 | 2,661.0 | 3,682.8 | 3,824.5 | 3,971.7 | 4,124.6 | 4,283.4 |
| Total Cash, percent | .0 | .0 | .0 | .0 | .0 | .0 | .0 | .0 | .0 | .0 |
| Account Receivables | 7,017.0 | 6,984.0 | 7,412.0 | 7,115.0 | 6,920.0 | 7,550.8 | 7,841.4 | 8,143.2 | 8,456.6 | 8,782.1 |
| Account Receivables, % | 27.75 | 24.43 | 24.58 | 24 | 23.69 | 24.89 | 24.89 | 24.89 | 24.89 | 24.89 |
| Inventories | 1,757.0 | 1,504.0 | 1,342.0 | 1,414.0 | 1,429.0 | 1,597.0 | 1,658.5 | 1,722.3 | 1,788.6 | 1,857.4 |
| Inventories, % | 6.95 | 5.26 | 4.45 | 4.77 | 4.89 | 5.26 | 5.26 | 5.26 | 5.26 | 5.26 |
| Accounts Payable | 571.0 | 800.0 | 1,403.0 | 1,100.0 | 953.0 | 1,012.1 | 1,051.1 | 1,091.6 | 1,133.6 | 1,177.2 |
| Accounts Payable, % | 2.26 | 2.8 | 4.65 | 3.71 | 3.26 | 3.34 | 3.34 | 3.34 | 3.34 | 3.34 |
| Capital Expenditure | -324.0 | -354.0 | -358.0 | -328.0 | -263.0 | -346.7 | -360.0 | -373.9 | -388.2 | -403.2 |
| Capital Expenditure, % | -1.28 | -1.24 | -1.19 | -1.11 | -0.90028 | -1.14 | -1.14 | -1.14 | -1.14 | -1.14 |
| Tax Rate, % | -0.21046 | -0.21046 | -0.21046 | -0.21046 | -0.21046 | -0.21046 | -0.21046 | -0.21046 | -0.21046 | -0.21046 |
| EBITAT | 3,244.3 | 5,499.6 | 2,283.9 | -161.6 | -5,328.2 | 1,316.7 | 1,367.4 | 1,420.0 | 1,474.7 | 1,531.4 |
| Depreciation | ||||||||||
| Changes in Account Receivables | ||||||||||
| Changes in Inventories | ||||||||||
| Changes in Accounts Payable | ||||||||||
| Capital Expenditure | ||||||||||
| UFCF | 6,155.3 | 6,050.6 | 2,667.9 | -149.6 | -5,166.2 | 3,306.4 | 3,888.6 | 4,038.2 | 4,193.7 | 4,355.1 |
| WACC, % | 6.38 | 6.74 | 7.11 | 5.41 | 7.11 | 6.55 | 6.55 | 6.55 | 6.55 | 6.55 |
| PV UFCF | ||||||||||
| SUM PV UFCF | 16,290.7 | |||||||||
| Long Term Growth Rate, % | 2.00 | |||||||||
| Free cash flow (T + 1) | 4,442 | |||||||||
| Terminal Value | 97,587 | |||||||||
| Present Terminal Value | 71,053 | |||||||||
| Enterprise Value | 87,344 | |||||||||
| Net Debt | 13,172 | |||||||||
| Equity Value | 74,172 | |||||||||
| Diluted Shares Outstanding, MM | 664 | |||||||||
| Equity Value Per Share | 111.71 |
What You Will Receive
- Pre-Populated Financial Model: Paramount Global’s (PARAA) actual data enables accurate DCF valuation.
- Comprehensive Forecast Control: Modify revenue growth, profit margins, WACC, and other essential drivers.
- Real-Time Calculations: Instant updates ensure you view results as adjustments are made.
- Investor-Ready Template: A polished Excel file crafted for high-quality valuation.
- Customizable and Reusable: Designed for versatility, allowing for repeated use in detailed forecasting.
Key Features
- Customizable Revenue Inputs: Adjust essential metrics such as advertising revenue, subscription growth, and content investment.
- Instant DCF Valuation: Provides immediate calculations for intrinsic value, NPV, and additional financial metrics.
- Industry-Leading Precision: Incorporates Paramount Global’s (PARAA) actual financial data for accurate valuation results.
- Effortless Scenario Testing: Explore various assumptions and evaluate results with ease.
- Efficiency Booster: Streamlines the valuation process, removing the need to create intricate models from the ground up.
How It Works
- Step 1: Download the prebuilt Excel template featuring Paramount Global’s (PARAA) data.
- Step 2: Navigate through the pre-filled sheets to familiarize yourself with the essential metrics.
- Step 3: Modify forecasts and assumptions in the editable yellow cells (WACC, growth, margins).
- Step 4: Instantly view the recalculated results, including Paramount Global’s intrinsic value.
- Step 5: Utilize the outputs to make informed investment decisions or create detailed reports.
Why Choose This Calculator for Paramount Global (PARAA)?
- User-Friendly Interface: Perfectly crafted for both novices and seasoned users.
- Customizable Inputs: Easily adjust parameters to suit your financial analysis.
- Real-Time Updates: Observe immediate changes in Paramount Global’s valuation as you tweak inputs.
- Preloaded Data: Comes with Paramount Global’s actual financial metrics for swift evaluations.
- Relied Upon by Experts: Favored by investors and analysts for making well-informed choices.
Who Should Use This Product?
- Professional Investors: Develop comprehensive and accurate valuation models for assessing Paramount Global (PARAA).
- Corporate Finance Teams: Evaluate valuation scenarios to inform internal decision-making and strategies.
- Consultants and Advisors: Offer clients precise valuation analysis for Paramount Global (PARAA) stock.
- Students and Educators: Utilize real-world data to enhance learning and practice in financial modeling.
- Media and Entertainment Analysts: Gain insights into how companies like Paramount Global (PARAA) are valued within the industry.
What the Template Contains
- Pre-Filled Data: Includes Paramount Global’s historical financials and forecasts.
- Discounted Cash Flow Model: Editable DCF valuation model with automatic calculations.
- Weighted Average Cost of Capital (WACC): A dedicated sheet for calculating WACC based on custom inputs.
- Key Financial Ratios: Analyze Paramount Global’s profitability, efficiency, and leverage.
- Customizable Inputs: Edit revenue growth, margins, and tax rates with ease.
- Clear Dashboard: Charts and tables summarizing key valuation results.
Disclaimer
All information, articles, and product details provided on this website are for general informational and educational purposes only. We do not claim any ownership over, nor do we intend to infringe upon, any trademarks, copyrights, logos, brand names, or other intellectual property mentioned or depicted on this site. Such intellectual property remains the property of its respective owners, and any references here are made solely for identification or informational purposes, without implying any affiliation, endorsement, or partnership.
We make no representations or warranties, express or implied, regarding the accuracy, completeness, or suitability of any content or products presented. Nothing on this website should be construed as legal, tax, investment, financial, medical, or other professional advice. In addition, no part of this site—including articles or product references—constitutes a solicitation, recommendation, endorsement, advertisement, or offer to buy or sell any securities, franchises, or other financial instruments, particularly in jurisdictions where such activity would be unlawful.
All content is of a general nature and may not address the specific circumstances of any individual or entity. It is not a substitute for professional advice or services. Any actions you take based on the information provided here are strictly at your own risk. You accept full responsibility for any decisions or outcomes arising from your use of this website and agree to release us from any liability in connection with your use of, or reliance upon, the content or products found herein.