
|
Pacira Biosciences ، Inc. (PCRX) DCF تقييم |
Fully Editable: Tailor To Your Needs In Excel Or Sheets
Professional Design: Trusted, Industry-Standard Templates
Investor-Approved Valuation Models
MAC/PC Compatible, Fully Unlocked
No Expertise Is Needed; Easy To Follow
Pacira BioSciences, Inc. (PCRX) Bundle
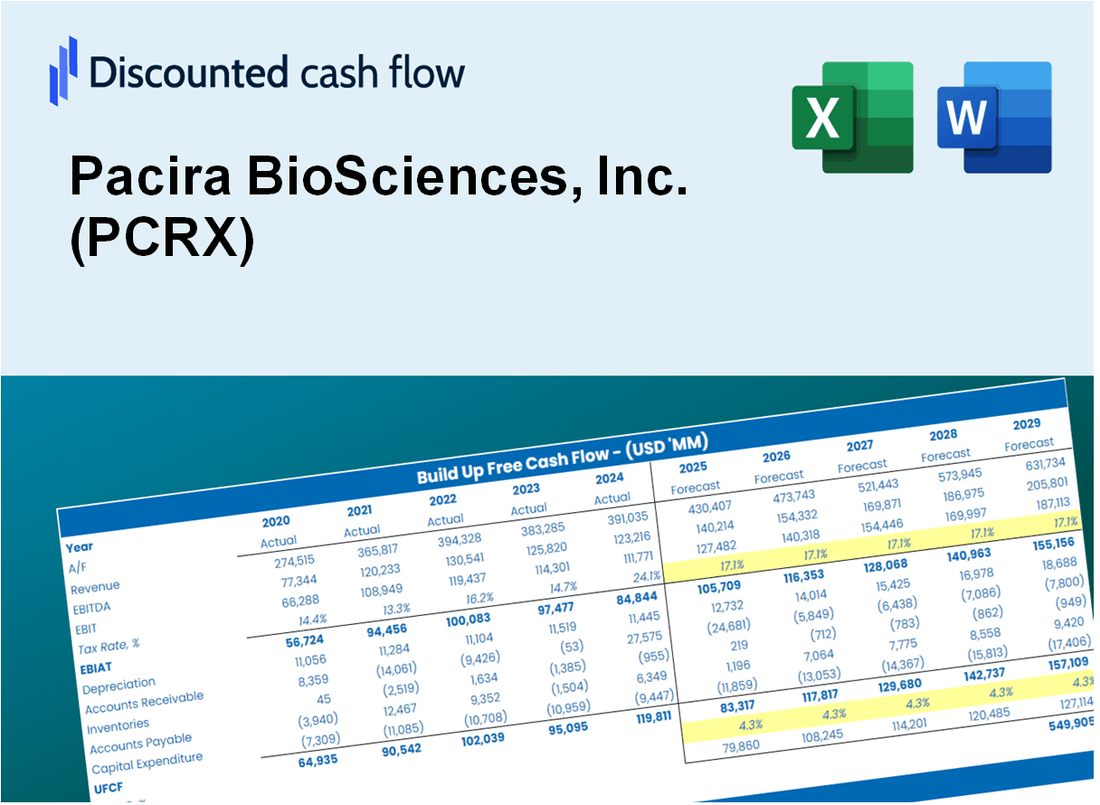
تحكم في تحليل تقييم Pacira Biosciences ، Inc. (PCRX) مع حاسبة DCF المتقدمة لدينا! يتم تحميله مسبقًا ببيانات حقيقية (PCRX) ، يتيح لك قالب Excel ضبط التوقعات والافتراضات لحساب القيمة الداخلية بدقة Pacira Biosciences ، Inc. (PCRX).
Discounted Cash Flow (DCF) - (USD MM)
| Year | AY1 2020 |
AY2 2021 |
AY3 2022 |
AY4 2023 |
AY5 2024 |
FY1 2025 |
FY2 2026 |
FY3 2027 |
FY4 2028 |
FY5 2029 |
|---|---|---|---|---|---|---|---|---|---|---|
| Revenue | 429.6 | 541.5 | 666.8 | 675.0 | 701.0 | 747.4 | 797.0 | 849.8 | 906.1 | 966.2 |
| Revenue Growth, % | 0 | 26.04 | 23.14 | 1.22 | 3.85 | 6.63 | 6.63 | 6.63 | 6.63 | 6.63 |
| EBITDA | 63.5 | 113.9 | 140.4 | 154.6 | 29.1 | 125.5 | 133.8 | 142.7 | 152.1 | 162.2 |
| EBITDA, % | 14.78 | 21.04 | 21.05 | 22.9 | 4.15 | 16.79 | 16.79 | 16.79 | 16.79 | 16.79 |
| Depreciation | 19.9 | 28.5 | 91.5 | 75.6 | 78.8 | 68.9 | 73.4 | 78.3 | 83.5 | 89.0 |
| Depreciation, % | 4.63 | 5.27 | 13.72 | 11.2 | 11.24 | 9.21 | 9.21 | 9.21 | 9.21 | 9.21 |
| EBIT | 43.6 | 85.4 | 48.9 | 79.0 | -49.7 | 56.6 | 60.4 | 64.4 | 68.6 | 73.2 |
| EBIT, % | 10.15 | 15.77 | 7.33 | 11.71 | -7.09 | 7.57 | 7.57 | 7.57 | 7.57 | 7.57 |
| Total Cash | 521.7 | 656.4 | 288.7 | 278.6 | 484.6 | 528.7 | 563.8 | 601.1 | 641.0 | 683.5 |
| Total Cash, percent | .0 | .0 | .0 | .0 | .0 | .0 | .0 | .0 | .0 | .0 |
| Account Receivables | 53.0 | 96.3 | 98.4 | 105.6 | 113.3 | 114.6 | 122.2 | 130.3 | 139.0 | 148.2 |
| Account Receivables, % | 12.35 | 17.79 | 14.76 | 15.64 | 16.16 | 15.34 | 15.34 | 15.34 | 15.34 | 15.34 |
| Inventories | 64.7 | 98.6 | 96.1 | 104.4 | 125.3 | 121.1 | 129.1 | 137.6 | 146.8 | 156.5 |
| Inventories, % | 15.05 | 18.2 | 14.41 | 15.46 | 17.87 | 16.2 | 16.2 | 16.2 | 16.2 | 16.2 |
| Accounts Payable | 10.4 | 10.5 | 15.2 | 15.7 | 19.1 | 17.5 | 18.7 | 19.9 | 21.2 | 22.6 |
| Accounts Payable, % | 2.43 | 1.95 | 2.28 | 2.33 | 2.73 | 2.34 | 2.34 | 2.34 | 2.34 | 2.34 |
| Capital Expenditure | -37.8 | -45.9 | -30.1 | -15.2 | -10.6 | -38.2 | -40.7 | -43.4 | -46.3 | -49.4 |
| Capital Expenditure, % | -8.8 | -8.47 | -4.51 | -2.25 | -1.52 | -5.11 | -5.11 | -5.11 | -5.11 | -5.11 |
| Tax Rate, % | -57.77 | -57.77 | -57.77 | -57.77 | -57.77 | -57.77 | -57.77 | -57.77 | -57.77 | -57.77 |
| EBITAT | 315.9 | 63.6 | 58.5 | 53.7 | -78.4 | 50.1 | 53.4 | 57.0 | 60.7 | 64.8 |
| Depreciation | ||||||||||
| Changes in Account Receivables | ||||||||||
| Changes in Inventories | ||||||||||
| Changes in Accounts Payable | ||||||||||
| Capital Expenditure | ||||||||||
| UFCF | 190.7 | -30.8 | 125.0 | 99.2 | -35.5 | 82.0 | 71.7 | 76.4 | 81.5 | 86.9 |
| WACC, % | 4.47 | 4.12 | 4.47 | 4.03 | 4.47 | 4.31 | 4.31 | 4.31 | 4.31 | 4.31 |
| PV UFCF | ||||||||||
| SUM PV UFCF | 351.0 | |||||||||
| Long Term Growth Rate, % | 4.00 | |||||||||
| Free cash flow (T + 1) | 90 | |||||||||
| Terminal Value | 28,845 | |||||||||
| Present Terminal Value | 23,355 | |||||||||
| Enterprise Value | 23,706 | |||||||||
| Net Debt | 362 | |||||||||
| Equity Value | 23,344 | |||||||||
| Diluted Shares Outstanding, MM | 46 | |||||||||
| Equity Value Per Share | 504.78 |
What You Will Get
- Editable Excel Template: A fully customizable Excel-based DCF Calculator featuring pre-filled real PCRX financials.
- Real-World Data: Access to historical data and forward-looking estimates (highlighted in the yellow cells).
- Forecast Flexibility: Adjust forecast assumptions such as revenue growth, EBITDA %, and WACC.
- Automatic Calculations: Quickly observe the effect of your inputs on Pacira BioSciences’ valuation.
- Professional Tool: Designed for investors, CFOs, consultants, and financial analysts.
- User-Friendly Design: Organized for clarity and ease of use, complete with step-by-step instructions.
Key Features
- Comprehensive DCF Model: Features detailed unlevered and levered DCF valuation frameworks tailored for Pacira BioSciences, Inc. (PCRX).
- WACC Analysis Tool: Pre-configured Weighted Average Cost of Capital spreadsheet with adjustable parameters.
- Customizable Forecast Inputs: Easily alter growth projections, capital investments, and discount rates.
- Integrated Financial Ratios: Evaluate profitability, leverage, and efficiency metrics specific to Pacira BioSciences, Inc. (PCRX).
- Visual Dashboard and Graphs: Graphical representations that encapsulate essential valuation indicators for straightforward assessment.
How It Works
- Download: Obtain the pre-built Excel file containing Pacira BioSciences' financial data.
- Customize: Modify forecasts, such as revenue growth, EBITDA %, and WACC.
- Update Automatically: The intrinsic value and NPV calculations refresh in real-time.
- Test Scenarios: Develop various projections and analyze results immediately.
- Make Decisions: Leverage the valuation outcomes to inform your investment approach.
Why Choose This Calculator for Pacira BioSciences, Inc. (PCRX)?
- Accuracy: Utilizes real Pacira financials to guarantee data precision.
- Flexibility: Built for users to easily test and adjust inputs as needed.
- Time-Saving: Avoid the complexity of constructing a DCF model from the ground up.
- Professional-Grade: Crafted with CFO-level attention to detail and usability.
- User-Friendly: Intuitive design allows even those without advanced financial modeling skills to navigate effortlessly.
Who Should Use Pacira BioSciences, Inc. (PCRX)?
- Investors: Gain insights into the pharmaceutical sector with a reliable investment analysis tool.
- Financial Analysts: Streamline your assessments with a comprehensive financial model tailored for biotech companies.
- Consultants: Easily modify the framework for client-specific presentations or strategic reports.
- Healthcare Enthusiasts: Enhance your knowledge of the biopharmaceutical landscape through detailed case studies.
- Educators and Students: Utilize it as a hands-on resource for courses in finance and healthcare management.
What the Template Contains
- Comprehensive DCF Model: Editable template with detailed valuation calculations tailored for Pacira BioSciences, Inc. (PCRX).
- Real-World Data: Pacira’s historical and projected financials preloaded for in-depth analysis.
- Customizable Parameters: Adjust WACC, growth rates, and tax assumptions to explore various scenarios.
- Financial Statements: Complete annual and quarterly breakdowns for enhanced insights into performance.
- Key Ratios: Integrated analysis focusing on profitability, efficiency, and leverage metrics.
- Dashboard with Visual Outputs: Engaging charts and tables providing clear, actionable results.
Disclaimer
All information, articles, and product details provided on this website are for general informational and educational purposes only. We do not claim any ownership over, nor do we intend to infringe upon, any trademarks, copyrights, logos, brand names, or other intellectual property mentioned or depicted on this site. Such intellectual property remains the property of its respective owners, and any references here are made solely for identification or informational purposes, without implying any affiliation, endorsement, or partnership.
We make no representations or warranties, express or implied, regarding the accuracy, completeness, or suitability of any content or products presented. Nothing on this website should be construed as legal, tax, investment, financial, medical, or other professional advice. In addition, no part of this site—including articles or product references—constitutes a solicitation, recommendation, endorsement, advertisement, or offer to buy or sell any securities, franchises, or other financial instruments, particularly in jurisdictions where such activity would be unlawful.
All content is of a general nature and may not address the specific circumstances of any individual or entity. It is not a substitute for professional advice or services. Any actions you take based on the information provided here are strictly at your own risk. You accept full responsibility for any decisions or outcomes arising from your use of this website and agree to release us from any liability in connection with your use of, or reliance upon, the content or products found herein.