
|
Pfizer Inc. (PFE) تقييم DCF |
Fully Editable: Tailor To Your Needs In Excel Or Sheets
Professional Design: Trusted, Industry-Standard Templates
Investor-Approved Valuation Models
MAC/PC Compatible, Fully Unlocked
No Expertise Is Needed; Easy To Follow
Pfizer Inc. (PFE) Bundle
تبسيط تقييم Pfizer Inc. (PFE) مع هذه الآلة الحاسبة DCF القابلة للتخصيص! يضم Real Pfizer Inc. (PFE) ومدخلات التنبؤ القابلة للتعديل ، يمكنك اختبار السيناريوهات وكشف القيمة العادلة في Pfizer Inc. (PFE) في دقائق.
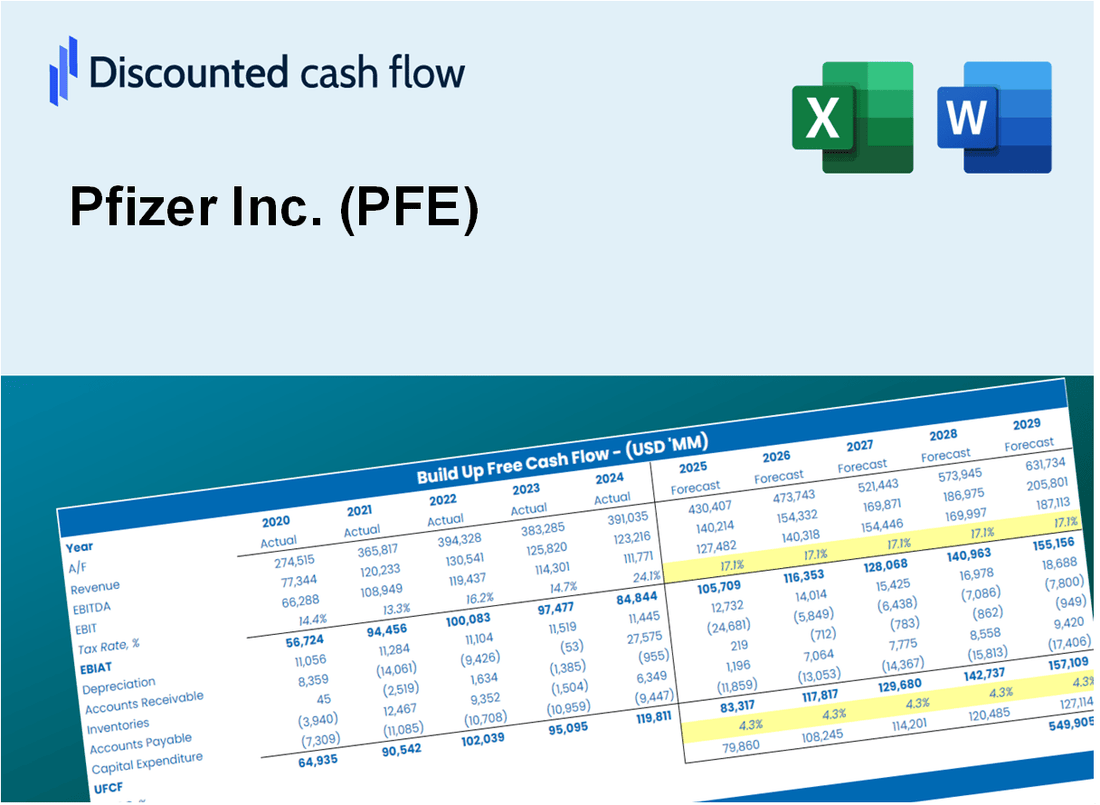
Discounted Cash Flow (DCF) - (USD MM)
| Year | AY1 2020 |
AY2 2021 |
AY3 2022 |
AY4 2023 |
AY5 2024 |
FY1 2025 |
FY2 2026 |
FY3 2027 |
FY4 2028 |
FY5 2029 |
|---|---|---|---|---|---|---|---|---|---|---|
| Revenue | 41,651.0 | 81,288.0 | 100,330.0 | 59,553.0 | 63,627.0 | 77,114.0 | 93,459.9 | 113,270.6 | 137,280.5 | 166,379.9 |
| Revenue Growth, % | 0 | 95.16 | 23.43 | -40.64 | 6.84 | 21.2 | 21.2 | 21.2 | 21.2 | 21.2 |
| EBITDA | 13,168.0 | 30,793.0 | 41,031.0 | 9,557.0 | 18,127.0 | 23,894.5 | 28,959.5 | 35,098.0 | 42,537.7 | 51,554.4 |
| EBITDA, % | 31.62 | 37.88 | 40.9 | 16.05 | 28.49 | 30.99 | 30.99 | 30.99 | 30.99 | 30.99 |
| Depreciation | 4,681.0 | 5,191.0 | 5,064.0 | 6,290.0 | 7,013.0 | 6,825.5 | 8,272.3 | 10,025.8 | 12,151.0 | 14,726.6 |
| Depreciation, % | 11.24 | 6.39 | 5.05 | 10.56 | 11.02 | 8.85 | 8.85 | 8.85 | 8.85 | 8.85 |
| EBIT | 8,487.0 | 25,602.0 | 35,967.0 | 3,267.0 | 11,114.0 | 17,069.0 | 20,687.1 | 25,072.2 | 30,386.7 | 36,827.8 |
| EBIT, % | 20.38 | 31.5 | 35.85 | 5.49 | 17.47 | 22.13 | 22.13 | 22.13 | 22.13 | 22.13 |
| Total Cash | 12,223.0 | 31,069.0 | 22,732.0 | 12,690.0 | 20,477.0 | 22,165.0 | 26,863.4 | 32,557.6 | 39,458.8 | 47,822.9 |
| Total Cash, percent | .0 | .0 | .0 | .0 | .0 | .0 | .0 | .0 | .0 | .0 |
| Account Receivables | 11,177.0 | 15,745.0 | 14,529.0 | 15,544.0 | 14,777.0 | 16,966.8 | 20,563.2 | 24,922.0 | 30,204.8 | 36,607.3 |
| Account Receivables, % | 26.83 | 19.37 | 14.48 | 26.1 | 23.22 | 22 | 22 | 22 | 22 | 22 |
| Inventories | 8,046.0 | 9,059.0 | 8,981.0 | 10,189.0 | 10,851.0 | 11,347.6 | 13,752.9 | 16,668.1 | 20,201.3 | 24,483.4 |
| Inventories, % | 19.32 | 11.14 | 8.95 | 17.11 | 17.05 | 14.72 | 14.72 | 14.72 | 14.72 | 14.72 |
| Accounts Payable | 4,283.0 | 5,578.0 | 6,809.0 | 6,710.0 | 5,633.0 | 6,794.1 | 8,234.2 | 9,979.6 | 12,095.0 | 14,658.8 |
| Accounts Payable, % | 10.28 | 6.86 | 6.79 | 11.27 | 8.85 | 8.81 | 8.81 | 8.81 | 8.81 | 8.81 |
| Capital Expenditure | -2,791.0 | -2,711.0 | -3,236.0 | -3,907.0 | -2,909.0 | -3,762.2 | -4,559.7 | -5,526.2 | -6,697.6 | -8,117.3 |
| Capital Expenditure, % | -6.7 | -3.34 | -3.23 | -6.56 | -4.57 | -4.88 | -4.88 | -4.88 | -4.88 | -4.88 |
| Tax Rate, % | 0.0373925 | 0.0373925 | 0.0373925 | 0.0373925 | 0.0373925 | 0.0373925 | 0.0373925 | 0.0373925 | 0.0373925 | 0.0373925 |
| EBITAT | 11,047.8 | 23,323.1 | 32,483.1 | 6,586.5 | 11,109.8 | 16,433.2 | 19,916.5 | 24,138.2 | 29,254.8 | 35,456.0 |
| Depreciation | ||||||||||
| Changes in Account Receivables | ||||||||||
| Changes in Inventories | ||||||||||
| Changes in Accounts Payable | ||||||||||
| Capital Expenditure | ||||||||||
| UFCF | -2,002.2 | 21,517.1 | 36,836.1 | 6,647.5 | 14,241.8 | 17,971.2 | 19,067.5 | 23,109.2 | 28,007.7 | 33,944.5 |
| WACC, % | 5.38 | 5.25 | 5.24 | 5.38 | 5.38 | 5.33 | 5.33 | 5.33 | 5.33 | 5.33 |
| PV UFCF | ||||||||||
| SUM PV UFCF | 102,961.9 | |||||||||
| Long Term Growth Rate, % | 0.50 | |||||||||
| Free cash flow (T + 1) | 34,114 | |||||||||
| Terminal Value | 706,344 | |||||||||
| Present Terminal Value | 544,831 | |||||||||
| Enterprise Value | 647,793 | |||||||||
| Net Debt | 65,950 | |||||||||
| Equity Value | 581,843 | |||||||||
| Diluted Shares Outstanding, MM | 5,700 | |||||||||
| Equity Value Per Share | 102.08 |
What You Will Get
- Real PFE Financial Data: Pre-filled with Pfizer’s historical and projected data for precise analysis.
- Fully Editable Template: Modify key inputs like revenue growth, WACC, and EBITDA % with ease.
- Automatic Calculations: See Pfizer’s intrinsic value update instantly based on your changes.
- Professional Valuation Tool: Designed for investors, analysts, and consultants seeking accurate DCF results.
- User-Friendly Design: Simple structure and clear instructions for all experience levels.
Key Features
- Pre-Loaded Data: Pfizer Inc.'s historical financial statements and pre-filled forecasts.
- Fully Adjustable Inputs: Modify WACC, tax rates, revenue growth, and EBITDA margins.
- Instant Results: View Pfizer's intrinsic value recalculating in real time.
- Clear Visual Outputs: Dashboard charts illustrate valuation results and key metrics.
- Built for Accuracy: A professional tool designed for analysts, investors, and finance experts.
How It Works
- Step 1: Download the Excel file.
- Step 2: Review pre-entered Pfizer data (historical and projected).
- Step 3: Adjust key assumptions (yellow cells) based on your analysis.
- Step 4: View automatic recalculations for Pfizer’s intrinsic value.
- Step 5: Use the outputs for investment decisions or reporting.
Why Choose This Calculator?
- User-Friendly Interface: Perfect for both novices and seasoned professionals.
- Customizable Inputs: Adjust parameters to suit your specific analysis needs.
- Real-Time Feedback: Observe immediate changes to Pfizer’s valuation as you tweak inputs.
- Preloaded Data: Comes with Pfizer’s actual financial information for swift evaluations.
- Relied Upon by Experts: Utilized by investors and analysts for making well-informed choices.
Who Should Use This Product?
- Pharmaceutical Students: Understand drug development processes and apply them using real-world case studies.
- Researchers: Integrate industry-standard models into your studies or publications.
- Healthcare Investors: Evaluate your investment strategies and analyze valuation metrics for Pfizer Inc. (PFE).
- Market Analysts: Enhance your analysis with a customizable financial model tailored for the pharmaceutical sector.
- Healthcare Professionals: Acquire knowledge on how major pharmaceutical companies like Pfizer are evaluated.
What the Template Contains
- Pre-Filled Data: Contains Pfizer Inc.’s (PFE) historical financials and projections.
- Discounted Cash Flow Model: Editable DCF valuation model featuring automatic calculations.
- Weighted Average Cost of Capital (WACC): A dedicated sheet for calculating WACC using custom inputs.
- Key Financial Ratios: Evaluate Pfizer Inc.’s (PFE) profitability, efficiency, and leverage.
- Customizable Inputs: Easily adjust revenue growth, margins, and tax rates.
- Clear Dashboard: Visual representations and tables summarizing key valuation outcomes.
Disclaimer
All information, articles, and product details provided on this website are for general informational and educational purposes only. We do not claim any ownership over, nor do we intend to infringe upon, any trademarks, copyrights, logos, brand names, or other intellectual property mentioned or depicted on this site. Such intellectual property remains the property of its respective owners, and any references here are made solely for identification or informational purposes, without implying any affiliation, endorsement, or partnership.
We make no representations or warranties, express or implied, regarding the accuracy, completeness, or suitability of any content or products presented. Nothing on this website should be construed as legal, tax, investment, financial, medical, or other professional advice. In addition, no part of this site—including articles or product references—constitutes a solicitation, recommendation, endorsement, advertisement, or offer to buy or sell any securities, franchises, or other financial instruments, particularly in jurisdictions where such activity would be unlawful.
All content is of a general nature and may not address the specific circumstances of any individual or entity. It is not a substitute for professional advice or services. Any actions you take based on the information provided here are strictly at your own risk. You accept full responsibility for any decisions or outcomes arising from your use of this website and agree to release us from any liability in connection with your use of, or reliance upon, the content or products found herein.