
|
Pultegroup ، Inc. (PHM) تقييم DCF |
Fully Editable: Tailor To Your Needs In Excel Or Sheets
Professional Design: Trusted, Industry-Standard Templates
Investor-Approved Valuation Models
MAC/PC Compatible, Fully Unlocked
No Expertise Is Needed; Easy To Follow
PulteGroup, Inc. (PHM) Bundle
اكتشف القيمة الحقيقية لـ Pultegroup ، Inc. (PHM) مع حاسبة DCF المتقدمة! اضبط الافتراضات الرئيسية واستكشاف السيناريوهات المختلفة وتقييم كيفية تأثير التغييرات على تقييم Pultegroup ، Inc. (PHM) - كل ذلك ضمن قالب Excel واحد.
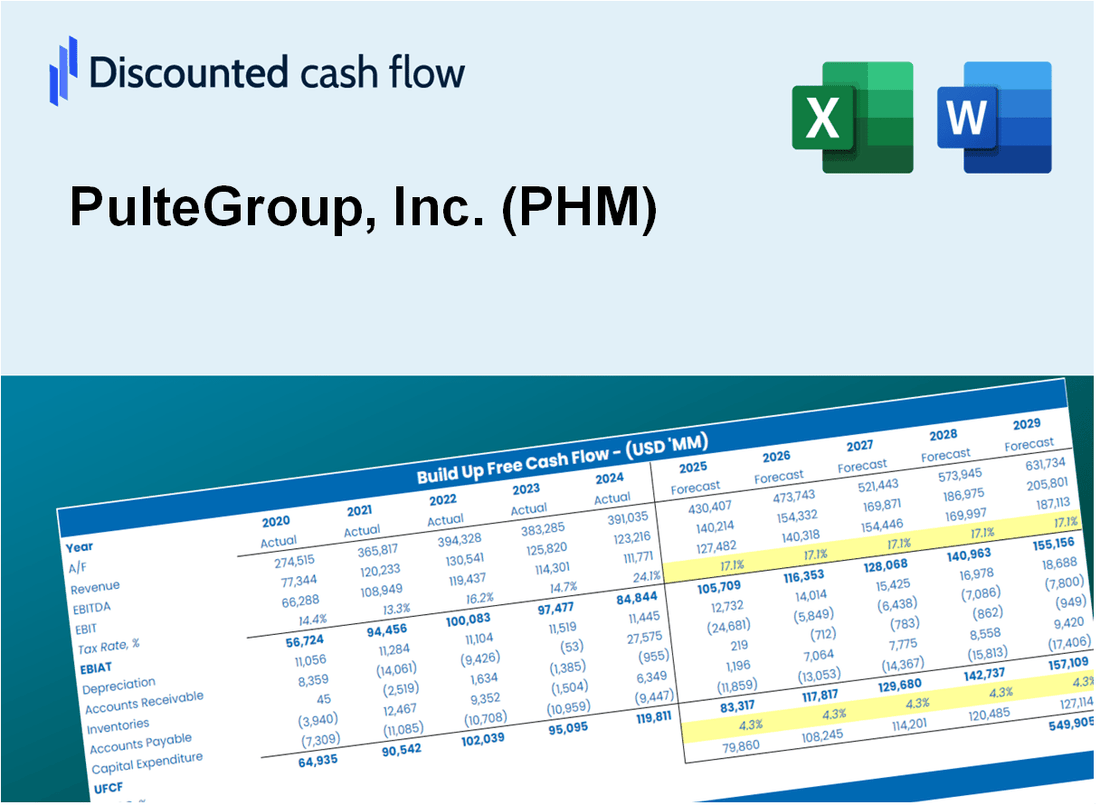
Discounted Cash Flow (DCF) - (USD MM)
| Year | AY1 2020 |
AY2 2021 |
AY3 2022 |
AY4 2023 |
AY5 2024 |
FY1 2025 |
FY2 2026 |
FY3 2027 |
FY4 2028 |
FY5 2029 |
|---|---|---|---|---|---|---|---|---|---|---|
| Revenue | 11,036.1 | 13,737.0 | 16,003.0 | 16,061.6 | 17,947.0 | 20,328.2 | 23,025.4 | 26,080.6 | 29,541.0 | 33,460.6 |
| Revenue Growth, % | 0 | 24.47 | 16.5 | 0.36618 | 11.74 | 13.27 | 13.27 | 13.27 | 13.27 | 13.27 |
| EBITDA | 1,799.0 | 2,580.3 | 3,510.8 | 3,530.6 | 4,095.5 | 4,139.8 | 4,689.1 | 5,311.3 | 6,016.0 | 6,814.2 |
| EBITDA, % | 16.3 | 18.78 | 21.94 | 21.98 | 22.82 | 20.36 | 20.36 | 20.36 | 20.36 | 20.36 |
| Depreciation | 66.1 | 70.0 | 70.9 | 80.8 | 89.2 | 103.7 | 117.5 | 133.1 | 150.7 | 170.7 |
| Depreciation, % | 0.59877 | 0.50923 | 0.44315 | 0.50321 | 0.49681 | 0.51024 | 0.51024 | 0.51024 | 0.51024 | 0.51024 |
| EBIT | 1,732.9 | 2,510.3 | 3,439.8 | 3,449.7 | 4,006.4 | 4,036.1 | 4,571.6 | 5,178.2 | 5,865.3 | 6,643.5 |
| EBIT, % | 15.7 | 18.27 | 21.5 | 21.48 | 22.32 | 19.85 | 19.85 | 19.85 | 19.85 | 19.85 |
| Total Cash | 2,582.2 | 1,787.7 | 1,053.1 | 1,806.6 | 1,613.3 | 2,570.7 | 2,911.8 | 3,298.1 | 3,735.7 | 4,231.4 |
| Total Cash, percent | .0 | .0 | .0 | .0 | .0 | .0 | .0 | .0 | .0 | .0 |
| Account Receivables | .0 | .0 | .0 | .0 | .0 | .0 | .0 | .0 | .0 | .0 |
| Account Receivables, % | 0 | 0 | 0 | 0 | 0 | 0 | 0 | 0 | 0 | 0 |
| Inventories | 7,749.8 | 9,076.8 | 11,368.3 | 11,819.2 | 12,692.8 | 14,296.7 | 16,193.7 | 18,342.3 | 20,776.0 | 23,532.7 |
| Inventories, % | 70.22 | 66.08 | 71.04 | 73.59 | 70.72 | 70.33 | 70.33 | 70.33 | 70.33 | 70.33 |
| Accounts Payable | 426.8 | 533.7 | 478.4 | 501.8 | 615.4 | 703.2 | 796.5 | 902.1 | 1,021.8 | 1,157.4 |
| Accounts Payable, % | 3.87 | 3.89 | 2.99 | 3.12 | 3.43 | 3.46 | 3.46 | 3.46 | 3.46 | 3.46 |
| Capital Expenditure | -58.4 | -72.8 | -112.7 | -92.2 | -118.5 | -121.9 | -138.0 | -156.3 | -177.1 | -200.6 |
| Capital Expenditure, % | -0.52876 | -0.52982 | -0.704 | -0.57405 | -0.66053 | -0.59943 | -0.59943 | -0.59943 | -0.59943 | -0.59943 |
| Tax Rate, % | 23.03 | 23.03 | 23.03 | 23.03 | 23.03 | 23.03 | 23.03 | 23.03 | 23.03 | 23.03 |
| EBITAT | 1,410.3 | 1,946.7 | 2,617.5 | 2,602.7 | 3,083.6 | 3,127.5 | 3,542.5 | 4,012.5 | 4,544.9 | 5,147.9 |
| Depreciation | ||||||||||
| Changes in Account Receivables | ||||||||||
| Changes in Inventories | ||||||||||
| Changes in Accounts Payable | ||||||||||
| Capital Expenditure | ||||||||||
| UFCF | -5,904.9 | 723.7 | 229.1 | 2,163.8 | 2,294.2 | 1,593.2 | 1,718.3 | 1,946.3 | 2,204.5 | 2,497.0 |
| WACC, % | 9.27 | 9.26 | 9.25 | 9.25 | 9.26 | 9.26 | 9.26 | 9.26 | 9.26 | 9.26 |
| PV UFCF | ||||||||||
| SUM PV UFCF | 7,541.0 | |||||||||
| Long Term Growth Rate, % | 2.00 | |||||||||
| Free cash flow (T + 1) | 2,547 | |||||||||
| Terminal Value | 35,098 | |||||||||
| Present Terminal Value | 22,545 | |||||||||
| Enterprise Value | 30,086 | |||||||||
| Net Debt | 242 | |||||||||
| Equity Value | 29,844 | |||||||||
| Diluted Shares Outstanding, MM | 210 | |||||||||
| Equity Value Per Share | 142.23 |
What You Will Get
- Real PHM Financial Data: Pre-filled with PulteGroup’s historical and projected data for precise analysis.
- Fully Editable Template: Modify key inputs like revenue growth, WACC, and EBITDA % with ease.
- Automatic Calculations: See PulteGroup’s intrinsic value update instantly based on your changes.
- Professional Valuation Tool: Designed for investors, analysts, and consultants seeking accurate DCF results.
- User-Friendly Design: Simple structure and clear instructions for all experience levels.
Key Features
- Comprehensive DCF Model: Features detailed unlevered and levered DCF valuation frameworks tailored for PulteGroup, Inc. (PHM).
- WACC Analysis Tool: Pre-configured Weighted Average Cost of Capital sheet with adjustable parameters.
- Customizable Forecast Inputs: Easily alter growth projections, capital investments, and discount rates.
- Integrated Financial Ratios: Evaluate profitability, debt levels, and efficiency ratios specific to PulteGroup, Inc. (PHM).
- User-Friendly Dashboard and Visuals: Graphical representations highlight essential valuation metrics for straightforward analysis.
How It Works
- Step 1: Download the Excel file.
- Step 2: Review PulteGroup, Inc.'s pre-filled financial data and forecasts.
- Step 3: Modify critical inputs like revenue growth, WACC, and tax rates (highlighted cells).
- Step 4: Watch the DCF model update instantly as you tweak assumptions.
- Step 5: Analyze the outputs and use the results for investment decisions.
Why Choose This Calculator for PulteGroup, Inc. (PHM)?
- Reliable Data: Access to authentic PulteGroup financials guarantees trustworthy valuation outcomes.
- Flexible Options: Tailor essential parameters such as growth rates, WACC, and tax rates to fit your forecasts.
- Efficient: Built-in calculations save you time and effort, allowing you to bypass initial setup.
- Professional-Quality Tool: Crafted for investors, analysts, and industry consultants.
- Easy to Use: The straightforward design and guided instructions make it accessible for all users.
Who Should Use PulteGroup, Inc. (PHM)?
- Homebuyers: Make informed decisions with insights from a leading homebuilder.
- Real Estate Analysts: Utilize comprehensive market data to assess housing trends.
- Investors: Leverage detailed reports to evaluate investment opportunities in residential construction.
- Industry Professionals: Adapt resources for presentations or discussions related to homebuilding.
- Students and Educators: Use as a case study for learning about the housing market and construction industry.
What the Template Contains
- Comprehensive DCF Model: Editable template featuring detailed valuation calculations.
- Real-World Data: PulteGroup’s historical and projected financials preloaded for analysis.
- Customizable Parameters: Modify WACC, growth rates, and tax assumptions to explore various scenarios.
- Financial Statements: Complete annual and quarterly breakdowns for enhanced insights.
- Key Ratios: Integrated analysis for profitability, efficiency, and leverage metrics.
- Dashboard with Visual Outputs: Charts and tables providing clear, actionable results.
Disclaimer
All information, articles, and product details provided on this website are for general informational and educational purposes only. We do not claim any ownership over, nor do we intend to infringe upon, any trademarks, copyrights, logos, brand names, or other intellectual property mentioned or depicted on this site. Such intellectual property remains the property of its respective owners, and any references here are made solely for identification or informational purposes, without implying any affiliation, endorsement, or partnership.
We make no representations or warranties, express or implied, regarding the accuracy, completeness, or suitability of any content or products presented. Nothing on this website should be construed as legal, tax, investment, financial, medical, or other professional advice. In addition, no part of this site—including articles or product references—constitutes a solicitation, recommendation, endorsement, advertisement, or offer to buy or sell any securities, franchises, or other financial instruments, particularly in jurisdictions where such activity would be unlawful.
All content is of a general nature and may not address the specific circumstances of any individual or entity. It is not a substitute for professional advice or services. Any actions you take based on the information provided here are strictly at your own risk. You accept full responsibility for any decisions or outcomes arising from your use of this website and agree to release us from any liability in connection with your use of, or reliance upon, the content or products found herein.