
|
Pilani Investment and Industries Corporation Limited (Pilaniinvs.ns) تقييم DCF |
Fully Editable: Tailor To Your Needs In Excel Or Sheets
Professional Design: Trusted, Industry-Standard Templates
Investor-Approved Valuation Models
MAC/PC Compatible, Fully Unlocked
No Expertise Is Needed; Easy To Follow
Pilani Investment and Industries Corporation Limited (PILANIINVS.NS) Bundle
اكتشف الإمكانات الحقيقية لـ Pilani Investment and Industries Corporation Limited مع حاسبة DCF المتقدمة! اضبط الافتراضات الرئيسية واستكشاف السيناريوهات المختلفة ، ودرس كيف تؤثر الاختلافات على تقييم Pilani Investment and Industries Corporation Limited - كل ذلك ضمن قالب Excel واحد.
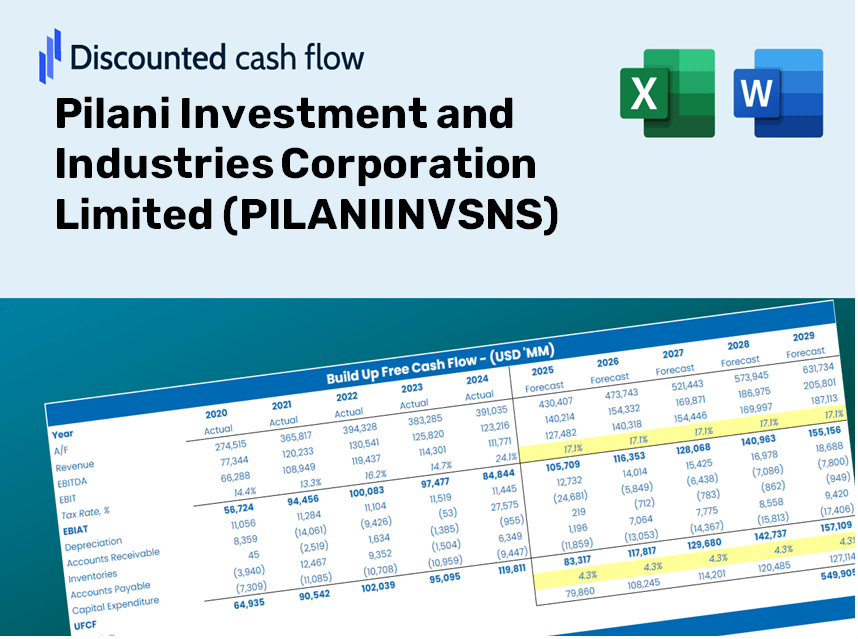
Discounted Cash Flow (DCF) - (USD MM)
| Year | AY1 2021 |
AY2 2022 |
AY3 2023 |
AY4 2024 |
AY5 2025 |
FY1 2026 |
FY2 2027 |
FY3 2028 |
FY4 2029 |
FY5 2030 |
|---|---|---|---|---|---|---|---|---|---|---|
| Revenue | 1,985.2 | 2,574.5 | 2,783.2 | 2,856.8 | 3,049.2 | 3,408.7 | 3,810.7 | 4,260.0 | 4,762.4 | 5,324.0 |
| Revenue Growth, % | 0 | 29.69 | 8.1 | 2.65 | 6.73 | 11.79 | 11.79 | 11.79 | 11.79 | 11.79 |
| EBITDA | 1,922.5 | 2,507.0 | 2,728.5 | 2,761.3 | 2,931.1 | 3,306.7 | 3,696.6 | 4,132.5 | 4,619.9 | 5,164.6 |
| EBITDA, % | 96.84 | 97.38 | 98.04 | 96.66 | 96.13 | 97.01 | 97.01 | 97.01 | 97.01 | 97.01 |
| Depreciation | 4.5 | 3.5 | 2.8 | 2.2 | 2.3 | 4.2 | 4.7 | 5.2 | 5.9 | 6.5 |
| Depreciation, % | 0.22582 | 0.13649 | 0.09956269 | 0.07777931 | 0.07526648 | 0.12298 | 0.12298 | 0.12298 | 0.12298 | 0.12298 |
| EBIT | 1,918.0 | 2,503.5 | 2,725.7 | 2,759.1 | 2,928.8 | 3,302.5 | 3,692.0 | 4,127.3 | 4,614.0 | 5,158.1 |
| EBIT, % | 96.61 | 97.24 | 97.94 | 96.58 | 96.05 | 96.88 | 96.88 | 96.88 | 96.88 | 96.88 |
| Total Cash | 242.4 | 365.9 | 422.1 | 474.6 | 483.9 | 505.0 | 564.5 | 631.1 | 705.5 | 788.7 |
| Total Cash, percent | .0 | .0 | .0 | .0 | .0 | .0 | .0 | .0 | .0 | .0 |
| Account Receivables | 4.5 | 3.0 | 4.3 | 9,004.5 | 19,045.4 | 1,366.9 | 1,528.1 | 1,708.3 | 1,909.7 | 2,134.9 |
| Account Receivables, % | 0.22793 | 0.11497 | 0.15479 | 315.2 | 624.61 | 40.1 | 40.1 | 40.1 | 40.1 | 40.1 |
| Inventories | -4.5 | -3.0 | -4.3 | 17.9 | .0 | .9 | 1.0 | 1.1 | 1.2 | 1.4 |
| Inventories, % | -0.22793 | -0.11497 | -0.15479 | 0.62524 | 0 | 0.02551015 | 0.02551015 | 0.02551015 | 0.02551015 | 0.02551015 |
| Accounts Payable | 1.4 | .6 | 1.2 | 1.2 | .3 | 1.3 | 1.5 | 1.6 | 1.8 | 2.1 |
| Accounts Payable, % | 0.07278798 | 0.02330512 | 0.04448164 | 0.04281012 | 0.00990435 | 0.03865784 | 0.03865784 | 0.03865784 | 0.03865784 | 0.03865784 |
| Capital Expenditure | .0 | .0 | .0 | -.2 | -4.6 | -1.1 | -1.2 | -1.4 | -1.5 | -1.7 |
| Capital Expenditure, % | -0.00120894 | 0 | 0 | -0.00703584 | -0.15027 | -0.03170308 | -0.03170308 | -0.03170308 | -0.03170308 | -0.03170308 |
| Tax Rate, % | 34.82 | 34.82 | 34.82 | 34.82 | 34.82 | 34.82 | 34.82 | 34.82 | 34.82 | 34.82 |
| EBITAT | 1,430.3 | 2,045.3 | 2,252.6 | 2,278.0 | 1,908.9 | 2,553.9 | 2,855.0 | 3,191.7 | 3,568.1 | 3,988.8 |
| Depreciation | ||||||||||
| Changes in Account Receivables | ||||||||||
| Changes in Inventories | ||||||||||
| Changes in Accounts Payable | ||||||||||
| Capital Expenditure | ||||||||||
| UFCF | 1,436.2 | 2,048.0 | 2,256.0 | -6,742.4 | -8,117.3 | 20,235.7 | 2,697.4 | 3,015.5 | 3,371.0 | 3,768.6 |
| WACC, % | 4.99 | 5.07 | 5.08 | 5.08 | 4.89 | 5.02 | 5.02 | 5.02 | 5.02 | 5.02 |
| PV UFCF | ||||||||||
| SUM PV UFCF | 30,037.3 | |||||||||
| Long Term Growth Rate, % | 2.00 | |||||||||
| Free cash flow (T + 1) | 3,844 | |||||||||
| Terminal Value | 127,179 | |||||||||
| Present Terminal Value | 99,542 | |||||||||
| Enterprise Value | 129,579 | |||||||||
| Net Debt | 19,166 | |||||||||
| Equity Value | 110,413 | |||||||||
| Diluted Shares Outstanding, MM | 11 | |||||||||
| Equity Value Per Share | 9,970.65 |
ماذا ستتلقى
- pilaniinvsns الأصيل: الوصول إلى البيانات التاريخية والتوقعات للتقييم الدقيق.
- مدخلات قابلة للتخصيص: اضبط المعلمات مثل WACC ومعدلات الضرائب ونمو الإيرادات والنفقات الرأسمالية.
- الحسابات الآلية: الحساب الديناميكي للقيمة الجوهرية و NPV.
- تحليل السيناريو: قم بتقييم السيناريوهات المختلفة لتقييم الأداء المستقبلي لـ Pilani Investment and Industries Corporation Limited.
- تصميم سهل الاستخدام: مصممة للمهنيين مع بقاء ودودين للوافدين الجدد.
الميزات الرئيسية
- مدخلات الاستثمار القابلة للتخصيص: اضبط المعلمات الأساسية مثل توقعات الإيرادات وهامش الأرباح قبل الفوائد والضرائب والإهلاك والاستهلاك الموسيقي وتقديرات استثمار رأس المال.
- تقييم DCF الفوري: يحسب بسرعة القيمة الجوهرية ، صافي القيمة الحالية (NPV) ، والمقاييس المالية الأخرى.
- دقة عالية الدقة: يعزز بيانات Pilani Investment and Industries Corporation المحدودة لنتائج التقييم التي يمكن الاعتماد عليها.
- تحليل السيناريو السهل: تقييم الافتراضات المختلفة بسهولة وتحليل الآثار الناتجة.
- حل تعزيز الكفاءة: تجنب متاعب بناء نماذج التقييم المعقدة من الألف إلى الياء.
كيف يعمل
- الخطوة 1: قم بتنزيل ملف Excel.
- الخطوة 2: فحص البيانات المعبأة مسبقًا لشركة Pilani Investment and Industries Corporation Limited (PILANIINVSNS)، بما في ذلك الأرقام التاريخية والمتوقعة.
- الخطوة 3: قم بتعديل الافتراضات الرئيسية (المميزة باللون الأصفر) وفقًا لتحليلك.
- الخطوة 4: لاحظ عمليات إعادة الحساب التلقائية التي تعكس القيمة الجوهرية لشركة بيلاني للاستثمار والصناعات المحدودة (PILANIINVSNS).
- الخطوة 5: استخدم النتائج لاستراتيجيات الاستثمار أو احتياجات الإبلاغ.
لماذا تختار هذه الآلة الحاسبة لـ Pilani Investment and Industries Corporation Limited (pilaniinvsns)؟
- مصمم للخبراء: أداة متطورة مصممة للمحللين والمديرين الماليين والمستشارين الماليين.
- بيانات دقيقة: يتم تحميل البيانات المالية التاريخية والمتوقعة للاستثمار في شركة Pilani Investment and Industries Limited (Pilaniinvsns) مسبقًا للدقة.
- تحليل السيناريو المرن: اختبار دون عناء التنبؤات والافتراضات.
- مخرجات شاملة: يحسب على الفور القيمة الجوهرية ، NPV ، والمقاييس المالية الأساسية.
- سهل الاستخدام: تقودك الإرشادات السهلة للمتابعة عبر كل خطوة من العملية.
من يمكنه الاستفادة من هذا المنتج؟
- المستثمرون: تقييم تقييم Pilani Investment and Industries Corporation Limited (Pilaniinvsns) قبل إجراء معاملات الأسهم.
- الماليين والمحللين الماليين: تحسين منهجيات التقييم والتحقق من التوقعات المالية.
- مؤسسو الشركات الناشئة: اكتشف مدى قيمة الكيانات العامة مثل Pilani Investment and Industries Corporation Limited (Pilaniinvsns).
- الاستشاريون: إنشاء تقارير تقييم مفصلة لعملائك.
- الطلاب والمعلمين: الاستفادة من بيانات السوق الحقيقية لممارسة استراتيجيات التقييم وتوجيهها.
محتويات القالب
- نموذج DCF الشامل: قالب قابل للتحرير يضم حسابات تقييم معقدة مصممة لصالح (pilaniinvsns).
- بيانات العالم الحقيقي: البيانات المالية التاريخية والمتوقعة لـ Pilani Investment and Industries Corporation Limited محدودة للتحليل الشامل.
- المعلمات القابلة للتخصيص: تعديل WACC ومعدلات النمو والافتراضات الضريبية لاستكشاف السيناريوهات المختلفة.
- البيانات المالية: الانهيارات المالية السنوية والفصلية الكاملة لتصوير رؤى محسنة.
- النسب الرئيسية: تحليل متكامل يغطي الربحية والكفاءة والرافعة المالية.
- لوحة القيادة مع المخرجات المرئية: إشراك المخططات والجداول لنتائج واضحة وقابلة للتنفيذ.
Disclaimer
All information, articles, and product details provided on this website are for general informational and educational purposes only. We do not claim any ownership over, nor do we intend to infringe upon, any trademarks, copyrights, logos, brand names, or other intellectual property mentioned or depicted on this site. Such intellectual property remains the property of its respective owners, and any references here are made solely for identification or informational purposes, without implying any affiliation, endorsement, or partnership.
We make no representations or warranties, express or implied, regarding the accuracy, completeness, or suitability of any content or products presented. Nothing on this website should be construed as legal, tax, investment, financial, medical, or other professional advice. In addition, no part of this site—including articles or product references—constitutes a solicitation, recommendation, endorsement, advertisement, or offer to buy or sell any securities, franchises, or other financial instruments, particularly in jurisdictions where such activity would be unlawful.
All content is of a general nature and may not address the specific circumstances of any individual or entity. It is not a substitute for professional advice or services. Any actions you take based on the information provided here are strictly at your own risk. You accept full responsibility for any decisions or outcomes arising from your use of this website and agree to release us from any liability in connection with your use of, or reliance upon, the content or products found herein.