
|
Pliant Therapeutics ، Inc. (PLRX) DCF تقييم |
Fully Editable: Tailor To Your Needs In Excel Or Sheets
Professional Design: Trusted, Industry-Standard Templates
Investor-Approved Valuation Models
MAC/PC Compatible, Fully Unlocked
No Expertise Is Needed; Easy To Follow
Pliant Therapeutics, Inc. (PLRX) Bundle
استكشف الآفاق المالية لـ Pliant Therapeutics ، Inc. (PLRX) مع حاسبة DCF سهلة الاستخدام! أدخل افتراضاتك للنمو والهوامش والمصروفات لحساب القيمة الجوهرية لـ Pliant Therapeutics ، Inc. (PLRX) وتعزيز نهج الاستثمار الخاص بك.
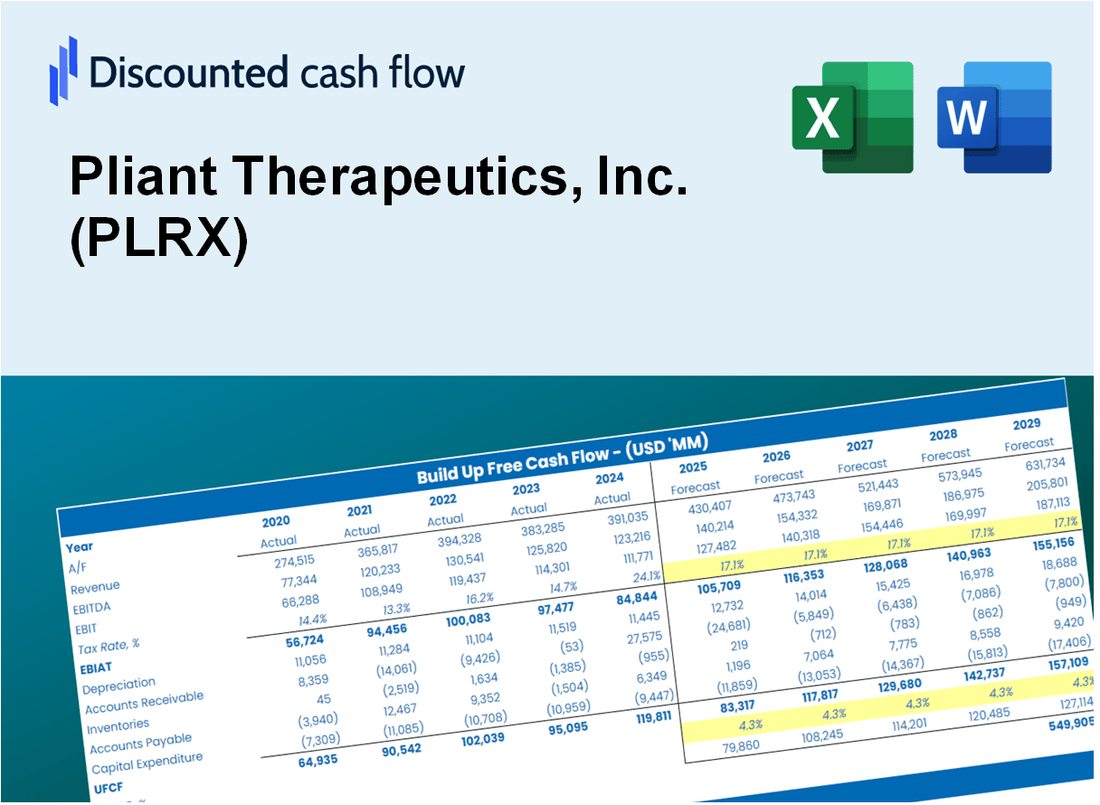
Discounted Cash Flow (DCF) - (USD MM)
| Year | AY1 2020 |
AY2 2021 |
AY3 2022 |
AY4 2023 |
AY5 2024 |
FY1 2025 |
FY2 2026 |
FY3 2027 |
FY4 2028 |
FY5 2029 |
|---|---|---|---|---|---|---|---|---|---|---|
| Revenue | 41.8 | 7.6 | 9.7 | 1.6 | .0 | .0 | .0 | .0 | .0 | .0 |
| Revenue Growth, % | 0 | -81.89 | 27.91 | -83.69 | -100 | -59.42 | -59.42 | -59.42 | -59.42 | -59.42 |
| EBITDA | -40.3 | -95.7 | -118.8 | -158.2 | -228.4 | .0 | .0 | .0 | .0 | .0 |
| EBITDA, % | -96.46 | -1264.24 | -1227.15 | -10014.43 | 100 | -59.29 | -59.29 | -59.29 | -59.29 | -59.29 |
| Depreciation | 1.3 | 1.5 | 3.7 | 1.8 | -39.1 | .0 | .0 | .0 | .0 | .0 |
| Depreciation, % | 3.13 | 20.27 | 38.01 | 116.52 | 100 | 52.28 | 52.28 | 52.28 | 52.28 | 52.28 |
| EBIT | -41.6 | -97.3 | -122.5 | -160.1 | -189.2 | .0 | .0 | .0 | .0 | .0 |
| EBIT, % | -99.59 | -1284.51 | -1265.15 | -10130.95 | 100 | -59.92 | -59.92 | -59.92 | -59.92 | -59.92 |
| Total Cash | 276.9 | 200.6 | 331.2 | 494.2 | 355.7 | .0 | .0 | .0 | .0 | .0 |
| Total Cash, percent | .0 | .0 | .0 | .0 | .0 | .0 | .0 | .0 | .0 | .0 |
| Account Receivables | 9.4 | 2.5 | 3.1 | 3.0 | 2.3 | .0 | .0 | .0 | .0 | .0 |
| Account Receivables, % | 22.39 | 32.57 | 32.46 | 189.68 | 100 | 57.48 | 57.48 | 57.48 | 57.48 | 57.48 |
| Inventories | .0 | .0 | .0 | .0 | .0 | .0 | .0 | .0 | .0 | .0 |
| Inventories, % | 0 | 0 | 0 | 0 | 100 | 20 | 20 | 20 | 20 | 20 |
| Accounts Payable | 2.0 | 3.0 | 1.6 | 4.5 | 6.0 | .0 | .0 | .0 | .0 | .0 |
| Accounts Payable, % | 4.84 | 39.24 | 16.31 | 286.77 | 100 | 52.08 | 52.08 | 52.08 | 52.08 | 52.08 |
| Capital Expenditure | -1.5 | -2.0 | -1.8 | -.9 | -3.8 | .0 | .0 | .0 | .0 | .0 |
| Capital Expenditure, % | -3.66 | -25.79 | -18.17 | -58.29 | 100 | -21.18 | -21.18 | -21.18 | -21.18 | -21.18 |
| Tax Rate, % | 0 | 0 | 0 | 0 | 0 | 0 | 0 | 0 | 0 | 0 |
| EBITAT | -41.6 | -97.3 | -122.5 | -160.1 | -189.2 | .0 | .0 | .0 | .0 | .0 |
| Depreciation | ||||||||||
| Changes in Account Receivables | ||||||||||
| Changes in Inventories | ||||||||||
| Changes in Accounts Payable | ||||||||||
| Capital Expenditure | ||||||||||
| UFCF | -49.2 | -89.8 | -122.7 | -156.1 | -230.1 | -3.7 | .0 | .0 | .0 | .0 |
| WACC, % | 8.37 | 8.37 | 8.37 | 8.37 | 8.37 | 8.37 | 8.37 | 8.37 | 8.37 | 8.37 |
| PV UFCF | ||||||||||
| SUM PV UFCF | -3.4 | |||||||||
| Long Term Growth Rate, % | 2.00 | |||||||||
| Free cash flow (T + 1) | 0 | |||||||||
| Terminal Value | 0 | |||||||||
| Present Terminal Value | 0 | |||||||||
| Enterprise Value | -3 | |||||||||
| Net Debt | -11 | |||||||||
| Equity Value | 8 | |||||||||
| Diluted Shares Outstanding, MM | 61 | |||||||||
| Equity Value Per Share | 0.13 |
What You Will Receive
- Comprehensive Financial Model: Pliant Therapeutics’ actual data facilitates accurate DCF valuation.
- Complete Forecasting Control: Modify revenue growth, profit margins, WACC, and other essential factors.
- Real-Time Calculations: Automatic updates provide immediate feedback as adjustments are made.
- Professional-Grade Template: A polished Excel file crafted for high-quality valuation analysis.
- Flexible and Reusable: Designed for adaptability, enabling repeated use for in-depth forecasts.
Key Features
- Comprehensive PLRX Data: Pre-loaded with Pliant Therapeutics' historical financial performance and future growth forecasts.
- Customizable Financial Inputs: Modify key metrics such as revenue growth, profit margins, WACC, tax rates, and capital expenditures.
- Interactive Valuation Model: Automatically recalculates Net Present Value (NPV) and intrinsic value based on your customized inputs.
- Scenario Analysis: Develop various forecast scenarios to evaluate different valuation possibilities.
- User-Centric Interface: Intuitive design tailored for both industry professionals and newcomers.
How It Works
- Step 1: Download the prebuilt Excel template featuring Pliant Therapeutics, Inc. (PLRX) data.
- Step 2: Navigate through the pre-filled sheets to grasp the essential metrics.
- Step 3: Modify forecasts and assumptions in the editable yellow cells (WACC, growth, margins).
- Step 4: Instantly see the recalculated results, including Pliant Therapeutics, Inc. (PLRX)'s intrinsic value.
- Step 5: Make well-informed investment decisions or create reports based on the outputs.
Why Choose This Calculator for Pliant Therapeutics, Inc. (PLRX)?
- User-Friendly Interface: Perfectly crafted for both novices and seasoned professionals.
- Customizable Inputs: Easily adjust parameters to suit your financial analysis needs.
- Real-Time Valuation: Observe immediate updates to Pliant Therapeutics’ valuation as you tweak the inputs.
- Preloaded Data: Comes with Pliant Therapeutics’ actual financial information for swift evaluations.
- Relied Upon by Experts: A go-to tool for investors and analysts aiming for informed decision-making.
Who Should Use This Product?
- Pharmaceutical Students: Understand drug development processes and apply them using real-world case studies.
- Researchers: Integrate advanced therapeutic models into academic projects or studies.
- Investors: Evaluate your investment strategies and assess valuation outcomes for Pliant Therapeutics, Inc. (PLRX).
- Market Analysts: Enhance your analysis with a customizable financial model tailored for biotech firms.
- Healthcare Entrepreneurs: Discover insights into how public biotech companies like Pliant Therapeutics are evaluated.
What the Template Contains
- Pre-Filled Data: Includes Pliant Therapeutics' historical financials and forecasts.
- Discounted Cash Flow Model: Editable DCF valuation model with automatic calculations.
- Weighted Average Cost of Capital (WACC): A dedicated sheet for calculating WACC based on custom inputs.
- Key Financial Ratios: Analyze Pliant Therapeutics' profitability, efficiency, and leverage.
- Customizable Inputs: Edit revenue growth, margins, and tax rates with ease.
- Clear Dashboard: Charts and tables summarizing key valuation results.
Disclaimer
All information, articles, and product details provided on this website are for general informational and educational purposes only. We do not claim any ownership over, nor do we intend to infringe upon, any trademarks, copyrights, logos, brand names, or other intellectual property mentioned or depicted on this site. Such intellectual property remains the property of its respective owners, and any references here are made solely for identification or informational purposes, without implying any affiliation, endorsement, or partnership.
We make no representations or warranties, express or implied, regarding the accuracy, completeness, or suitability of any content or products presented. Nothing on this website should be construed as legal, tax, investment, financial, medical, or other professional advice. In addition, no part of this site—including articles or product references—constitutes a solicitation, recommendation, endorsement, advertisement, or offer to buy or sell any securities, franchises, or other financial instruments, particularly in jurisdictions where such activity would be unlawful.
All content is of a general nature and may not address the specific circumstances of any individual or entity. It is not a substitute for professional advice or services. Any actions you take based on the information provided here are strictly at your own risk. You accept full responsibility for any decisions or outcomes arising from your use of this website and agree to release us from any liability in connection with your use of, or reliance upon, the content or products found herein.