
|
Porch Group ، Inc. (PRCH) تقييم DCF |
Fully Editable: Tailor To Your Needs In Excel Or Sheets
Professional Design: Trusted, Industry-Standard Templates
Investor-Approved Valuation Models
MAC/PC Compatible, Fully Unlocked
No Expertise Is Needed; Easy To Follow
Porch Group, Inc. (PRCH) Bundle
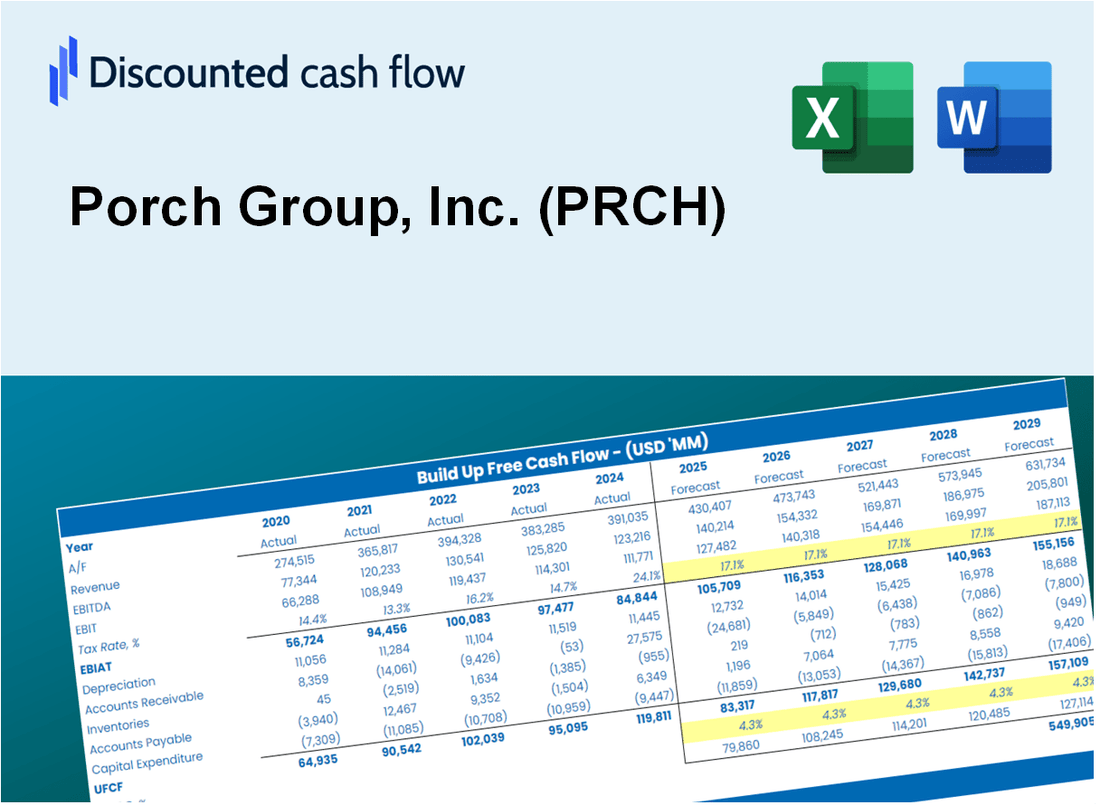
تُمكّنك حاسبة DCF الخاصة بنا من أجل الدقة ، من تقييم تقييم Porch Group ، Inc. باستخدام البيانات المالية في العالم الحقيقي ، مما يوفر مرونة كاملة لتعديل جميع المعلمات الأساسية للتوقعات المحسنة.
Discounted Cash Flow (DCF) - (USD MM)
| Year | AY1 2020 |
AY2 2021 |
AY3 2022 |
AY4 2023 |
AY5 2024 |
FY1 2025 |
FY2 2026 |
FY3 2027 |
FY4 2028 |
FY5 2029 |
|---|---|---|---|---|---|---|---|---|---|---|
| Revenue | 72.3 | 192.4 | 275.9 | 430.3 | 437.8 | 658.0 | 988.7 | 1,485.8 | 2,232.7 | 3,355.2 |
| Revenue Growth, % | 0 | 166.16 | 43.4 | 55.94 | 1.75 | 50.27 | 50.27 | 50.27 | 50.27 | 50.27 |
| EBITDA | -34.3 | -94.7 | -119.1 | -77.1 | 37.3 | -196.4 | -295.2 | -443.5 | -666.5 | -1,001.6 |
| EBITDA, % | -47.5 | -49.23 | -43.15 | -17.91 | 8.53 | -29.85 | -29.85 | -29.85 | -29.85 | -29.85 |
| Depreciation | 6.6 | 16.4 | 27.9 | 24.4 | 25.5 | 51.8 | 77.8 | 116.9 | 175.6 | 263.9 |
| Depreciation, % | 9.19 | 8.52 | 10.12 | 5.67 | 5.83 | 7.87 | 7.87 | 7.87 | 7.87 | 7.87 |
| EBIT | -41.0 | -111.1 | -147.0 | -101.5 | 11.8 | -248.2 | -372.9 | -560.4 | -842.1 | -1,265.5 |
| EBIT, % | -56.69 | -57.75 | -53.27 | -23.58 | 2.7 | -37.72 | -37.72 | -37.72 | -37.72 | -37.72 |
| Total Cash | 196.0 | 325.0 | 251.6 | 294.0 | 191.7 | 530.7 | 797.5 | 1,198.4 | 1,800.9 | 2,706.2 |
| Total Cash, percent | .0 | .0 | .0 | .0 | .0 | .0 | .0 | .0 | .0 | .0 |
| Account Receivables | 4.3 | 257.2 | 324.5 | 107.9 | 111.4 | 337.4 | 507.1 | 762.0 | 1,145.0 | 1,720.7 |
| Account Receivables, % | 5.9 | 133.65 | 117.59 | 25.07 | 25.44 | 51.28 | 51.28 | 51.28 | 51.28 | 51.28 |
| Inventories | .0 | .0 | .0 | .0 | .0 | .0 | .0 | .0 | .0 | .0 |
| Inventories, % | 0 | 0 | 0 | 0 | 0 | 0 | 0 | 0 | 0 | 0 |
| Accounts Payable | 9.2 | 7.0 | 6.3 | 8.8 | 4.5 | 28.5 | 42.9 | 64.5 | 96.9 | 145.6 |
| Accounts Payable, % | 12.73 | 3.62 | 2.27 | 2.04 | 1.04 | 4.34 | 4.34 | 4.34 | 4.34 | 4.34 |
| Capital Expenditure | -2.9 | -4.7 | -10.5 | -10.1 | -.5 | -16.7 | -25.1 | -37.7 | -56.6 | -85.0 |
| Capital Expenditure, % | -3.98 | -2.44 | -3.79 | -2.35 | -0.11945 | -2.53 | -2.53 | -2.53 | -2.53 | -2.53 |
| Tax Rate, % | -6.89 | -6.89 | -6.89 | -6.89 | -6.89 | -6.89 | -6.89 | -6.89 | -6.89 | -6.89 |
| EBITAT | -39.7 | -101.4 | -147.8 | -102.0 | 12.6 | -242.3 | -364.1 | -547.2 | -822.2 | -1,235.6 |
| Depreciation | ||||||||||
| Changes in Account Receivables | ||||||||||
| Changes in Inventories | ||||||||||
| Changes in Accounts Payable | ||||||||||
| Capital Expenditure | ||||||||||
| UFCF | -31.0 | -344.8 | -198.3 | 131.5 | 29.9 | -409.2 | -466.7 | -701.3 | -1,053.9 | -1,583.6 |
| WACC, % | 15.83 | 15.65 | 15.92 | 15.92 | 15.92 | 15.85 | 15.85 | 15.85 | 15.85 | 15.85 |
| PV UFCF | ||||||||||
| SUM PV UFCF | -2,496.2 | |||||||||
| Long Term Growth Rate, % | 2.00 | |||||||||
| Free cash flow (T + 1) | -1,615 | |||||||||
| Terminal Value | -11,666 | |||||||||
| Present Terminal Value | -5,591 | |||||||||
| Enterprise Value | -8,087 | |||||||||
| Net Debt | 236 | |||||||||
| Equity Value | -8,324 | |||||||||
| Diluted Shares Outstanding, MM | 100 | |||||||||
| Equity Value Per Share | -83.58 |
What You Will Get
- Real PRCH Financial Data: Pre-filled with Porch Group’s historical and projected data for precise analysis.
- Fully Editable Template: Modify key inputs like revenue growth, WACC, and EBITDA % with ease.
- Automatic Calculations: See Porch Group’s intrinsic value update instantly based on your changes.
- Professional Valuation Tool: Designed for investors, analysts, and consultants seeking accurate DCF results.
- User-Friendly Design: Simple structure and clear instructions for all experience levels.
Key Features
- Comprehensive PRCH Data: Pre-loaded with Porch Group’s historical performance metrics and future projections.
- Customizable Variables: Modify revenue growth rates, profit margins, discount rates, tax implications, and capital investments.
- Interactive Valuation Model: Real-time updates to Net Present Value (NPV) and intrinsic value based on your adjustments.
- Scenario Analysis: Develop various forecasting scenarios to evaluate different valuation possibilities.
- User-Centric Interface: Intuitive design that caters to both experts and newcomers in the field.
How It Works
- 1. Access the Template: Download and open the Excel file containing Porch Group, Inc.'s (PRCH) preloaded data.
- 2. Modify Assumptions: Adjust key inputs such as growth rates, WACC, and capital expenditures as needed.
- 3. View Results Instantly: The DCF model automatically calculates intrinsic value and NPV in real-time.
- 4. Explore Scenarios: Analyze various forecasts to assess different valuation outcomes.
- 5. Present with Confidence: Share professional valuation insights to enhance your decision-making process.
Why Choose This Calculator for Porch Group, Inc. (PRCH)?
- Accuracy: Reliable financial data ensures precision in calculations.
- Flexibility: Tailored for users to easily adjust and test their inputs.
- Time-Saving: Avoid the complexities of constructing a DCF model from the ground up.
- Professional-Grade: Engineered with the expertise and usability expected by CFOs.
- User-Friendly: Intuitive design makes it accessible for users with varying levels of financial knowledge.
Who Should Use Porch Group, Inc. (PRCH)?
- Real Estate Professionals: Utilize advanced analytics to enhance property valuation and investment strategies.
- Researchers: Integrate industry-specific models into academic studies or publications.
- Investors: Evaluate your investment hypotheses and assess the financial performance of Porch Group, Inc. (PRCH).
- Market Analysts: Optimize your analysis process with a tailored, ready-to-use financial model.
- Entrepreneurs: Understand the evaluation methods used for public companies like Porch Group, Inc. (PRCH) to inform your business decisions.
What the Template Contains
- Historical Data: Includes Porch Group, Inc. (PRCH)’s past financials and baseline forecasts.
- DCF and Levered DCF Models: Detailed templates to calculate Porch Group, Inc. (PRCH)’s intrinsic value.
- WACC Sheet: Pre-built calculations for Weighted Average Cost of Capital.
- Editable Inputs: Modify key drivers like growth rates, EBITDA %, and CAPEX assumptions.
- Quarterly and Annual Statements: A complete breakdown of Porch Group, Inc. (PRCH)’s financials.
- Interactive Dashboard: Visualize valuation results and projections dynamically.
Disclaimer
All information, articles, and product details provided on this website are for general informational and educational purposes only. We do not claim any ownership over, nor do we intend to infringe upon, any trademarks, copyrights, logos, brand names, or other intellectual property mentioned or depicted on this site. Such intellectual property remains the property of its respective owners, and any references here are made solely for identification or informational purposes, without implying any affiliation, endorsement, or partnership.
We make no representations or warranties, express or implied, regarding the accuracy, completeness, or suitability of any content or products presented. Nothing on this website should be construed as legal, tax, investment, financial, medical, or other professional advice. In addition, no part of this site—including articles or product references—constitutes a solicitation, recommendation, endorsement, advertisement, or offer to buy or sell any securities, franchises, or other financial instruments, particularly in jurisdictions where such activity would be unlawful.
All content is of a general nature and may not address the specific circumstances of any individual or entity. It is not a substitute for professional advice or services. Any actions you take based on the information provided here are strictly at your own risk. You accept full responsibility for any decisions or outcomes arising from your use of this website and agree to release us from any liability in connection with your use of, or reliance upon, the content or products found herein.