
|
Paysafe Limited (PSFE) تقييم DCF |
Fully Editable: Tailor To Your Needs In Excel Or Sheets
Professional Design: Trusted, Industry-Standard Templates
Investor-Approved Valuation Models
MAC/PC Compatible, Fully Unlocked
No Expertise Is Needed; Easy To Follow
Paysafe Limited (PSFE) Bundle
تقييم التوقعات المالية لـ Paysafe Limited مع الخبرة! توفر حاسبة PSFE DCF هذه البيانات المالية المليئة مسبقًا وتوفر مرونة كاملة لتعديل نمو الإيرادات ، WACC ، الهوامش ، وغيرها من الافتراضات الحرجة التي تتماشى مع توقعاتك.
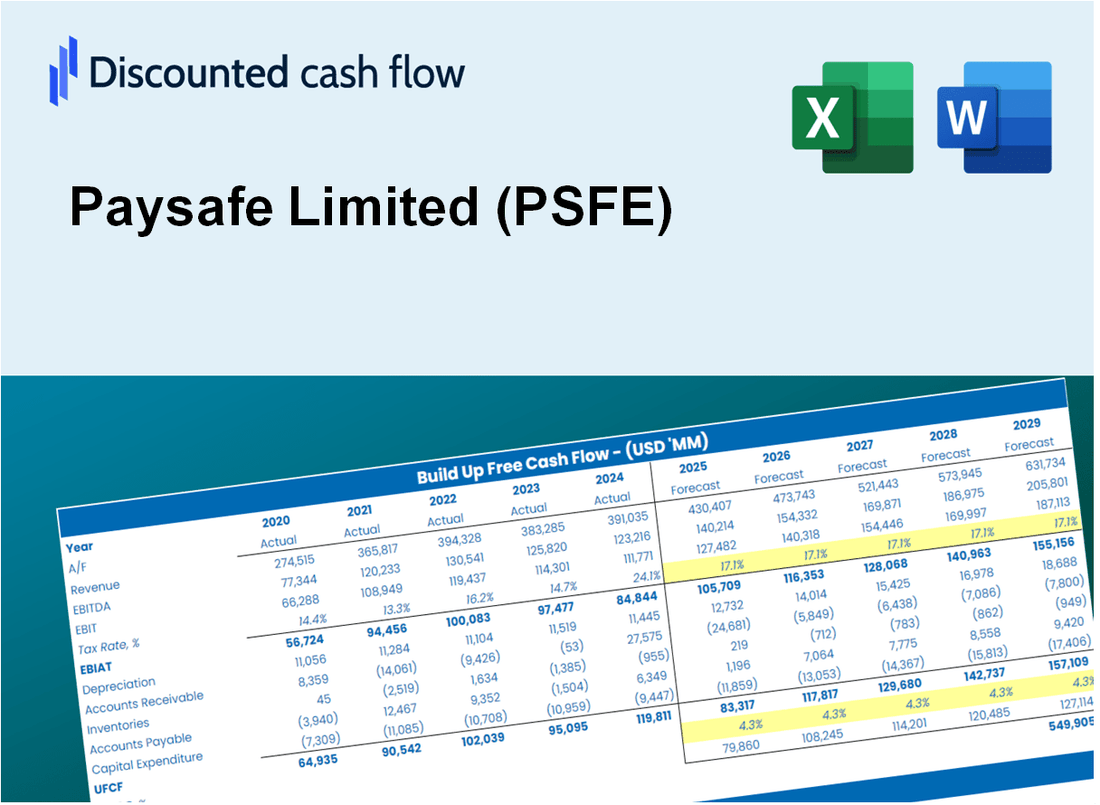
Discounted Cash Flow (DCF) - (USD MM)
| Year | AY1 2020 |
AY2 2021 |
AY3 2022 |
AY4 2023 |
AY5 2024 |
FY1 2025 |
FY2 2026 |
FY3 2027 |
FY4 2028 |
FY5 2029 |
|---|---|---|---|---|---|---|---|---|---|---|
| Revenue | 1,426.5 | 1,487.0 | 1,496.1 | 1,601.1 | 1,704.8 | 1,783.0 | 1,864.9 | 1,950.4 | 2,039.9 | 2,133.5 |
| Revenue Growth, % | 0 | 4.24 | 0.61358 | 7.02 | 6.48 | 4.59 | 4.59 | 4.59 | 4.59 | 4.59 |
| EBITDA | 425.8 | 342.1 | 292.8 | 427.6 | 412.3 | 439.8 | 459.9 | 481.0 | 503.1 | 526.2 |
| EBITDA, % | 29.85 | 23.01 | 19.57 | 26.71 | 24.19 | 24.66 | 24.66 | 24.66 | 24.66 | 24.66 |
| Depreciation | 268.2 | 261.4 | 266.8 | 264.1 | 274.8 | 309.6 | 323.8 | 338.7 | 354.2 | 370.5 |
| Depreciation, % | 18.8 | 17.58 | 17.83 | 16.5 | 16.12 | 17.36 | 17.36 | 17.36 | 17.36 | 17.36 |
| EBIT | 157.6 | 80.8 | 26.0 | 163.5 | 137.6 | 130.1 | 136.1 | 142.4 | 148.9 | 155.7 |
| EBIT, % | 11.05 | 5.43 | 1.74 | 10.21 | 8.07 | 7.3 | 7.3 | 7.3 | 7.3 | 7.3 |
| Total Cash | 387.6 | 313.4 | 260.2 | 202.3 | 216.7 | 324.5 | 339.4 | 354.9 | 371.2 | 388.2 |
| Total Cash, percent | .0 | .0 | .0 | .0 | .0 | .0 | .0 | .0 | .0 | .0 |
| Account Receivables | 373.4 | 307.0 | 307.1 | 333.3 | 296.8 | 376.5 | 393.7 | 411.8 | 430.7 | 450.5 |
| Account Receivables, % | 26.18 | 20.64 | 20.53 | 20.82 | 17.41 | 21.11 | 21.11 | 21.11 | 21.11 | 21.11 |
| Inventories | .0 | .0 | 1,867.0 | .0 | .0 | 356.6 | 373.0 | 390.1 | 408.0 | 426.7 |
| Inventories, % | 0 | 0 | 124.79 | 0 | 0 | 20 | 20 | 20 | 20 | 20 |
| Accounts Payable | 27.2 | 18.6 | 46.0 | 49.7 | 57.6 | 45.3 | 47.4 | 49.6 | 51.9 | 54.2 |
| Accounts Payable, % | 1.9 | 1.25 | 3.07 | 3.1 | 3.38 | 2.54 | 2.54 | 2.54 | 2.54 | 2.54 |
| Capital Expenditure | -86.9 | -147.7 | -4.5 | -132.9 | -120.5 | -113.0 | -118.2 | -123.7 | -129.3 | -135.3 |
| Capital Expenditure, % | -6.09 | -9.94 | -0.30365 | -8.3 | -7.07 | -6.34 | -6.34 | -6.34 | -6.34 | -6.34 |
| Tax Rate, % | -58.01 | -58.01 | -58.01 | -58.01 | -58.01 | -58.01 | -58.01 | -58.01 | -58.01 | -58.01 |
| EBITAT | 107.4 | 45.8 | 25.3 | -160.8 | 217.4 | 83.9 | 87.7 | 91.7 | 95.9 | 100.3 |
| Depreciation | ||||||||||
| Changes in Account Receivables | ||||||||||
| Changes in Inventories | ||||||||||
| Changes in Accounts Payable | ||||||||||
| Capital Expenditure | ||||||||||
| UFCF | -57.6 | 217.4 | -1,552.2 | 1,814.9 | 416.2 | -168.2 | 261.8 | 273.8 | 286.3 | 299.5 |
| WACC, % | 5.26 | 4.69 | 6.7 | 1.88 | 6.84 | 5.07 | 5.07 | 5.07 | 5.07 | 5.07 |
| PV UFCF | ||||||||||
| SUM PV UFCF | 781.7 | |||||||||
| Long Term Growth Rate, % | 2.00 | |||||||||
| Free cash flow (T + 1) | 305 | |||||||||
| Terminal Value | 9,935 | |||||||||
| Present Terminal Value | 7,757 | |||||||||
| Enterprise Value | 8,539 | |||||||||
| Net Debt | 2,190 | |||||||||
| Equity Value | 6,349 | |||||||||
| Diluted Shares Outstanding, MM | 62 | |||||||||
| Equity Value Per Share | 102.57 |
What You Will Get
- Real Paysafe Data: Preloaded financials – from revenue to EBIT – based on actual and projected figures.
- Full Customization: Adjust all critical parameters (yellow cells) like WACC, growth %, and tax rates.
- Instant Valuation Updates: Automatic recalculations to analyze the impact of changes on Paysafe's fair value.
- Versatile Excel Template: Tailored for quick edits, scenario testing, and detailed projections.
- Time-Saving and Accurate: Skip building models from scratch while maintaining precision and flexibility.
Key Features
- Customizable Financial Inputs: Adjust essential variables such as transaction volume, revenue growth rates, and operational costs.
- Instant DCF Valuation: Automatically computes intrinsic value, net present value (NPV), and additional metrics in real-time.
- High Precision Results: Leverages Paysafe Limited’s (PSFE) actual financial data for accurate valuation results.
- Effortless Scenario Analysis: Easily evaluate various assumptions and analyze different outcomes without hassle.
- Efficiency Booster: Streamlines the valuation process, removing the need for intricate model development from the ground up.
How It Works
- 1. Access the Template: Download and open the Excel file containing Paysafe Limited’s (PSFE) preloaded data.
- 2. Adjust Assumptions: Modify essential inputs such as growth rates, WACC, and capital expenditures.
- 3. View Results Instantly: The DCF model automatically calculates intrinsic value and NPV in real-time.
- 4. Explore Scenarios: Analyze various forecasts to evaluate different valuation possibilities.
- 5. Present with Assurance: Deliver professional valuation insights to enhance your decision-making process.
Why Choose This Calculator for Paysafe Limited (PSFE)?
- All-in-One Solution: Combines DCF, WACC, and financial ratio analyses tailored for Paysafe Limited.
- Flexible Inputs: Modify the highlighted cells to explore different financial scenarios for PSFE.
- In-Depth Analysis: Automatically computes the intrinsic value and Net Present Value for Paysafe Limited.
- Preloaded Information: Historical and projected data provide a solid foundation for analysis.
- Expert-Level Tool: Perfect for financial analysts, investors, and consultants focused on PSFE.
Who Should Use This Product?
- Individual Investors: Make informed decisions about buying or selling Paysafe Limited (PSFE) stock.
- Financial Analysts: Streamline valuation processes with ready-to-use financial models for Paysafe Limited (PSFE).
- Consultants: Deliver professional valuation insights on Paysafe Limited (PSFE) to clients quickly and accurately.
- Business Owners: Understand how companies like Paysafe Limited (PSFE) are valued to guide your own strategy.
- Finance Students: Learn valuation techniques using real-world data and scenarios related to Paysafe Limited (PSFE).
What the Template Contains
- Pre-Filled Data: Contains Paysafe Limited's historical financials and projections.
- Discounted Cash Flow Model: An editable DCF valuation model with automated calculations.
- Weighted Average Cost of Capital (WACC): A specific sheet for calculating WACC using custom inputs.
- Key Financial Ratios: Evaluate Paysafe Limited's profitability, efficiency, and leverage metrics.
- Customizable Inputs: Easily modify revenue growth, margins, and tax rates.
- Clear Dashboard: Visuals and tables that summarize essential valuation results.
Disclaimer
All information, articles, and product details provided on this website are for general informational and educational purposes only. We do not claim any ownership over, nor do we intend to infringe upon, any trademarks, copyrights, logos, brand names, or other intellectual property mentioned or depicted on this site. Such intellectual property remains the property of its respective owners, and any references here are made solely for identification or informational purposes, without implying any affiliation, endorsement, or partnership.
We make no representations or warranties, express or implied, regarding the accuracy, completeness, or suitability of any content or products presented. Nothing on this website should be construed as legal, tax, investment, financial, medical, or other professional advice. In addition, no part of this site—including articles or product references—constitutes a solicitation, recommendation, endorsement, advertisement, or offer to buy or sell any securities, franchises, or other financial instruments, particularly in jurisdictions where such activity would be unlawful.
All content is of a general nature and may not address the specific circumstances of any individual or entity. It is not a substitute for professional advice or services. Any actions you take based on the information provided here are strictly at your own risk. You accept full responsibility for any decisions or outcomes arising from your use of this website and agree to release us from any liability in connection with your use of, or reliance upon, the content or products found herein.