
|
Performance Shipping Inc. (PSHG) تقييم DCF |
Fully Editable: Tailor To Your Needs In Excel Or Sheets
Professional Design: Trusted, Industry-Standard Templates
Investor-Approved Valuation Models
MAC/PC Compatible, Fully Unlocked
No Expertise Is Needed; Easy To Follow
Performance Shipping Inc. (PSHG) Bundle
تقييم الآفاق المالية لشركة الأداء الشحن (PSHG) بدقة الخبراء! توفر لك حاسبة DCF (PSHG) هذه البيانات المالية المليئة مسبقًا والمرونة لتعديل نمو الإيرادات ، و WACC ، والهوامش ، وغيرها من الافتراضات الحرجة التي تتماشى مع توقعاتك.
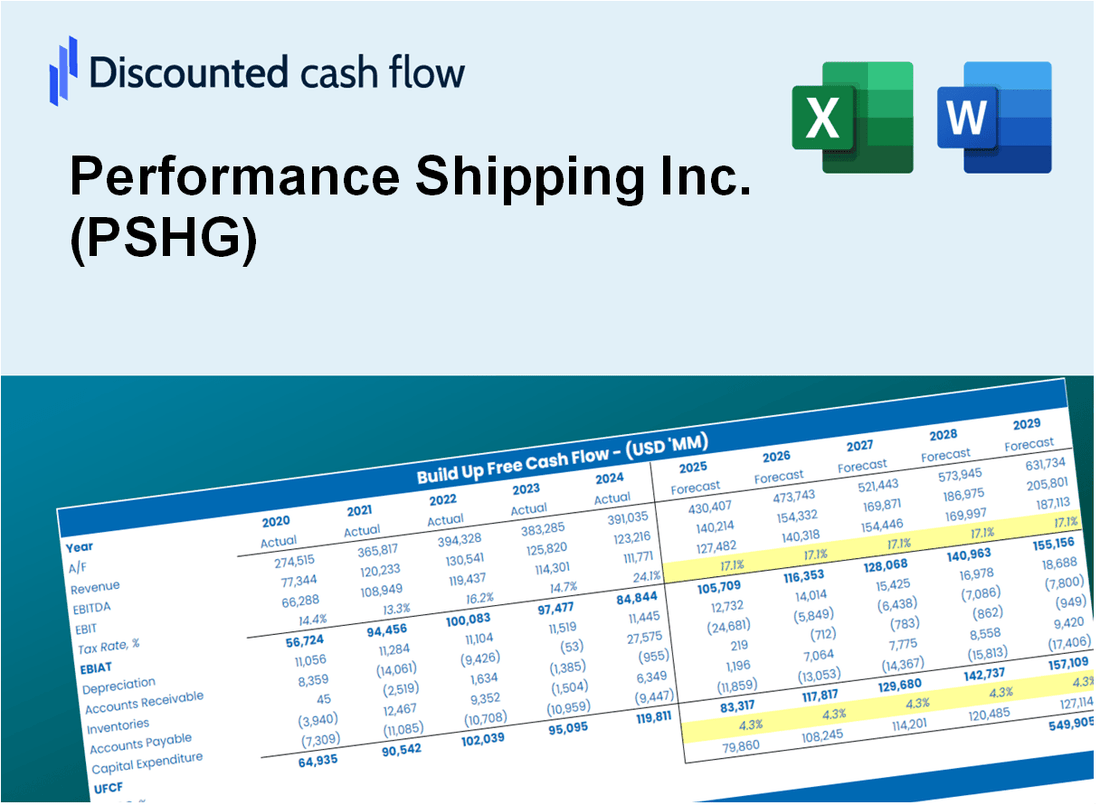
Discounted Cash Flow (DCF) - (USD MM)
| Year | AY1 2020 |
AY2 2021 |
AY3 2022 |
AY4 2023 |
AY5 2024 |
FY1 2025 |
FY2 2026 |
FY3 2027 |
FY4 2028 |
FY5 2029 |
|---|---|---|---|---|---|---|---|---|---|---|
| Revenue | 42.0 | 36.5 | 75.2 | 108.9 | 87.4 | 111.9 | 143.3 | 183.4 | 234.7 | 300.4 |
| Revenue Growth, % | 0 | -13.21 | 106 | 44.92 | -19.73 | 27.99 | 27.99 | 27.99 | 27.99 | 27.99 |
| EBITDA | 10.2 | -.8 | 49.5 | 93.8 | 56.0 | 53.3 | 68.2 | 87.3 | 111.7 | 143.0 |
| EBITDA, % | 24.22 | -2.28 | 65.91 | 86.11 | 64.08 | 47.61 | 47.61 | 47.61 | 47.61 | 47.61 |
| Depreciation | 5.8 | 7.5 | 9.3 | 14.8 | 14.2 | 17.1 | 21.9 | 28.0 | 35.9 | 45.9 |
| Depreciation, % | 13.79 | 20.48 | 12.35 | 13.58 | 16.26 | 15.29 | 15.29 | 15.29 | 15.29 | 15.29 |
| EBIT | 4.4 | -8.3 | 40.3 | 79.0 | 41.8 | 36.2 | 46.3 | 59.3 | 75.8 | 97.1 |
| EBIT, % | 10.43 | -22.76 | 53.56 | 72.53 | 47.82 | 32.32 | 32.32 | 32.32 | 32.32 | 32.32 |
| Total Cash | 21.4 | 9.6 | 38.7 | 67.3 | 70.3 | 60.6 | 77.6 | 99.3 | 127.1 | 162.7 |
| Total Cash, percent | .0 | .0 | .0 | .0 | .0 | .0 | .0 | .0 | .0 | .0 |
| Account Receivables | 3.5 | 3.8 | 9.1 | 8.3 | 5.8 | 10.1 | 12.9 | 16.5 | 21.2 | 27.1 |
| Account Receivables, % | 8.33 | 10.39 | 12.12 | 7.6 | 6.64 | 9.02 | 9.02 | 9.02 | 9.02 | 9.02 |
| Inventories | 2.0 | 4.3 | 3.0 | 2.2 | .5 | 5.2 | 6.6 | 8.5 | 10.9 | 13.9 |
| Inventories, % | 4.71 | 11.75 | 4.04 | 2.02 | 0.62782 | 4.63 | 4.63 | 4.63 | 4.63 | 4.63 |
| Accounts Payable | 1.5 | 5.7 | 4.6 | 4.6 | 2.2 | 7.2 | 9.2 | 11.8 | 15.1 | 19.3 |
| Accounts Payable, % | 3.5 | 15.74 | 6.09 | 4.25 | 2.53 | 6.42 | 6.42 | 6.42 | 6.42 | 6.42 |
| Capital Expenditure | -63.6 | -1.8 | -145.6 | -11.9 | -47.4 | -60.5 | -77.4 | -99.0 | -126.8 | -162.2 |
| Capital Expenditure, % | -151.29 | -4.89 | -193.65 | -10.94 | -54.22 | -54.01 | -54.01 | -54.01 | -54.01 | -54.01 |
| Tax Rate, % | 0 | 0 | 0 | 0 | 0 | 0 | 0 | 0 | 0 | 0 |
| EBITAT | 7.2 | -8.3 | 40.3 | 79.0 | 41.8 | 36.2 | 46.3 | 59.3 | 75.8 | 97.1 |
| Depreciation | ||||||||||
| Changes in Account Receivables | ||||||||||
| Changes in Inventories | ||||||||||
| Changes in Accounts Payable | ||||||||||
| Capital Expenditure | ||||||||||
| UFCF | -54.6 | -.9 | -101.3 | 83.6 | 10.3 | -11.1 | -11.4 | -14.6 | -18.7 | -24.0 |
| WACC, % | 4.31 | 4.31 | 4.31 | 4.31 | 4.31 | 4.31 | 4.31 | 4.31 | 4.31 | 4.31 |
| PV UFCF | ||||||||||
| SUM PV UFCF | -69.3 | |||||||||
| Long Term Growth Rate, % | 0.50 | |||||||||
| Free cash flow (T + 1) | -24 | |||||||||
| Terminal Value | -633 | |||||||||
| Present Terminal Value | -513 | |||||||||
| Enterprise Value | -582 | |||||||||
| Net Debt | -23 | |||||||||
| Equity Value | -559 | |||||||||
| Diluted Shares Outstanding, MM | 39 | |||||||||
| Equity Value Per Share | -14.26 |
What You Will Receive
- Comprehensive Financial Model: Performance Shipping Inc.’s actual data supports accurate DCF valuation.
- Complete Forecast Control: Modify revenue growth, margins, WACC, and other essential drivers.
- Real-Time Calculations: Automatic updates provide immediate results as you make adjustments.
- Professional-Grade Template: A polished Excel file crafted for high-quality valuation.
- Flexible and Reusable: Designed for adaptability, allowing repeated use for thorough forecasts.
Key Features
- Real-Time PSHG Data: Pre-loaded with Performance Shipping Inc.'s historical performance metrics and future outlooks.
- Customizable Variables: Modify fleet utilization rates, operational costs, shipping rates, and capital investments.
- Interactive Valuation Framework: Instant updates to Net Present Value (NPV) and intrinsic value based on your adjustments.
- Scenario Analysis: Develop various forecasting scenarios to evaluate different valuation results.
- Intuitive Interface: Clean, organized, and tailored for both experienced users and newcomers.
How It Works
- Download the Template: Gain immediate access to the Excel-based PSHG DCF Calculator.
- Input Your Assumptions: Modify the yellow-highlighted cells for growth rates, WACC, margins, and additional factors.
- Instant Calculations: The model automatically recalculates Performance Shipping Inc.’s intrinsic value.
- Test Scenarios: Experiment with various assumptions to assess potential changes in valuation.
- Analyze and Decide: Utilize the outcomes to inform your investment or financial analysis.
Why Choose This Calculator for Performance Shipping Inc. (PSHG)?
- Designed for Industry Experts: A sophisticated tool utilized by maritime analysts, CFOs, and logistics consultants.
- Accurate Data: Performance Shipping’s historical and projected financials are preloaded for precision.
- Flexible Scenario Analysis: Effortlessly simulate various forecasts and assumptions.
- Comprehensive Outputs: Automatically computes intrinsic value, NPV, and essential metrics.
- User-Friendly: Step-by-step guidance simplifies the calculation process.
Who Should Use This Product?
- Investors: Evaluate Performance Shipping Inc.’s (PSHG) financial health before making investment decisions.
- CFOs and Financial Analysts: Optimize valuation methodologies and assess future earnings projections for (PSHG).
- Startup Founders: Understand the valuation strategies applied to publicly traded companies like Performance Shipping Inc. (PSHG).
- Consultants: Create detailed valuation reports for clients involving (PSHG) and similar firms.
- Students and Educators: Utilize real-time data from Performance Shipping Inc. (PSHG) to practice and instruct on valuation principles.
What the Template Contains
- Pre-Filled Data: Includes Performance Shipping Inc.'s (PSHG) historical financials and forecasts.
- Discounted Cash Flow Model: Editable DCF valuation model with automatic calculations.
- Weighted Average Cost of Capital (WACC): A dedicated sheet for calculating WACC based on custom inputs.
- Key Financial Ratios: Analyze Performance Shipping Inc.'s (PSHG) profitability, efficiency, and leverage.
- Customizable Inputs: Edit revenue growth, margins, and tax rates with ease.
- Clear Dashboard: Charts and tables summarizing key valuation results.
Disclaimer
All information, articles, and product details provided on this website are for general informational and educational purposes only. We do not claim any ownership over, nor do we intend to infringe upon, any trademarks, copyrights, logos, brand names, or other intellectual property mentioned or depicted on this site. Such intellectual property remains the property of its respective owners, and any references here are made solely for identification or informational purposes, without implying any affiliation, endorsement, or partnership.
We make no representations or warranties, express or implied, regarding the accuracy, completeness, or suitability of any content or products presented. Nothing on this website should be construed as legal, tax, investment, financial, medical, or other professional advice. In addition, no part of this site—including articles or product references—constitutes a solicitation, recommendation, endorsement, advertisement, or offer to buy or sell any securities, franchises, or other financial instruments, particularly in jurisdictions where such activity would be unlawful.
All content is of a general nature and may not address the specific circumstances of any individual or entity. It is not a substitute for professional advice or services. Any actions you take based on the information provided here are strictly at your own risk. You accept full responsibility for any decisions or outcomes arising from your use of this website and agree to release us from any liability in connection with your use of, or reliance upon, the content or products found herein.