
|
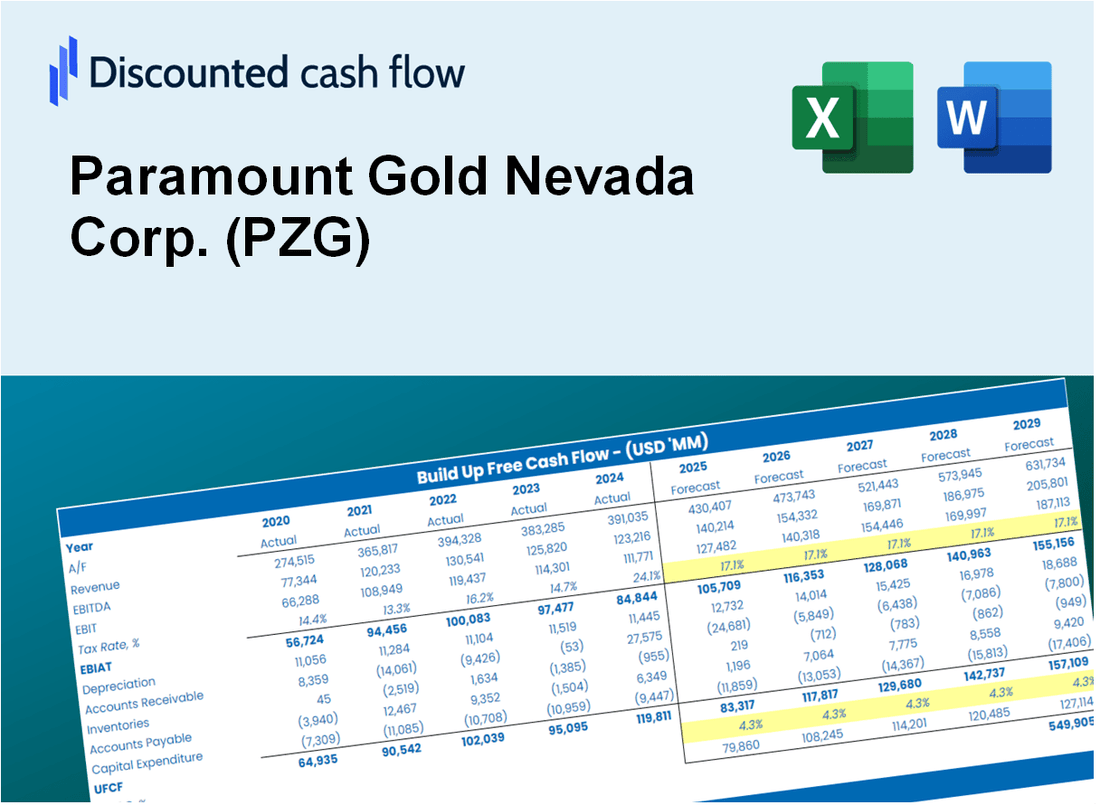
Paramount Gold Nevada Corp. (PZG) DCF تقييم |
Fully Editable: Tailor To Your Needs In Excel Or Sheets
Professional Design: Trusted, Industry-Standard Templates
Investor-Approved Valuation Models
MAC/PC Compatible, Fully Unlocked
No Expertise Is Needed; Easy To Follow
Paramount Gold Nevada Corp. (PZG) Bundle
اكتشف القيمة الحقيقية لشركة Paramount Gold Nevada Corp (PZG) مع حاسبة DCF المهنية! اضبط الافتراضات الرئيسية ، واستكشف السيناريوهات المختلفة ، وفحص كيفية تأثير التغييرات على تقييم Paramount Gold Nevada Corp. (PZG) - كل ذلك ضمن قالب Excel واحد.
What You Will Get
- Editable Forecast Inputs: Easily adjust assumptions (growth %, margins, WACC) to explore various scenarios.
- Real-World Data: Paramount Gold Nevada Corp.'s (PZG) financial data pre-filled to kickstart your analysis.
- Automatic DCF Outputs: The template computes Net Present Value (NPV) and intrinsic value automatically.
- Customizable and Professional: A refined Excel model that tailors to your valuation requirements.
- Built for Analysts and Investors: Perfect for evaluating projections, validating strategies, and optimizing time.
Key Features
- Comprehensive DCF Calculator: Offers detailed unlevered and levered DCF valuation models tailored for Paramount Gold Nevada Corp. (PZG).
- WACC Calculator: Includes a pre-built Weighted Average Cost of Capital sheet with customizable inputs specific to the mining sector.
- Adjustable Forecast Assumptions: Easily modify growth rates, capital expenditures, and discount rates relevant to PZG.
- Integrated Financial Ratios: Evaluate profitability, leverage, and efficiency ratios specifically for Paramount Gold Nevada Corp. (PZG).
- Interactive Dashboard and Charts: Visual outputs present key valuation metrics for straightforward analysis.
How It Works
- Download: Access the comprehensive Excel file featuring Paramount Gold Nevada Corp.'s (PZG) financial data.
- Customize: Tailor your forecasts, including gold production estimates, operating costs, and discount rates.
- Update Automatically: The intrinsic value and NPV calculations refresh in real-time.
- Test Scenarios: Develop various projections and analyze results instantly.
- Make Decisions: Leverage the valuation insights to inform your investment choices.
Why Choose This Calculator for Paramount Gold Nevada Corp. (PZG)?
- User-Friendly Interface: Perfectly suited for both novice and experienced users.
- Customizable Inputs: Easily adjust parameters to suit your financial analysis.
- Real-Time Valuation: Watch immediate updates to Paramount Gold’s valuation as you change inputs.
- Preloaded Data: Comes with Paramount Gold’s actual financial statistics for quick insights.
- Relied Upon by Experts: Favored by investors and analysts for making well-informed choices.
Who Should Use This Product?
- Investors: Accurately assess Paramount Gold Nevada Corp.'s (PZG) fair value before making investment choices.
- CFOs: Utilize a professional-grade DCF model for financial reporting and analysis related to Paramount Gold Nevada Corp. (PZG).
- Consultants: Efficiently customize the template for valuation reports tailored to clients involving Paramount Gold Nevada Corp. (PZG).
- Entrepreneurs: Acquire insights into financial modeling practices adopted by leading mining companies, including Paramount Gold Nevada Corp. (PZG).
- Educators: Employ it as a teaching resource to illustrate valuation methodologies relevant to the mining sector, specifically for Paramount Gold Nevada Corp. (PZG).
What the Template Contains
- Comprehensive DCF Model: Editable template featuring detailed valuation calculations tailored for Paramount Gold Nevada Corp. (PZG).
- Real-World Data: Paramount Gold Nevada Corp.’s historical and projected financials preloaded for in-depth analysis.
- Customizable Parameters: Modify WACC, growth rates, and tax assumptions to explore various scenarios.
- Financial Statements: Complete annual and quarterly breakdowns providing deeper insights into performance.
- Key Ratios: Integrated analysis for assessing profitability, efficiency, and leverage specific to (PZG).
- Dashboard with Visual Outputs: Charts and tables designed for clear, actionable insights regarding (PZG).
Disclaimer
All information, articles, and product details provided on this website are for general informational and educational purposes only. We do not claim any ownership over, nor do we intend to infringe upon, any trademarks, copyrights, logos, brand names, or other intellectual property mentioned or depicted on this site. Such intellectual property remains the property of its respective owners, and any references here are made solely for identification or informational purposes, without implying any affiliation, endorsement, or partnership.
We make no representations or warranties, express or implied, regarding the accuracy, completeness, or suitability of any content or products presented. Nothing on this website should be construed as legal, tax, investment, financial, medical, or other professional advice. In addition, no part of this site—including articles or product references—constitutes a solicitation, recommendation, endorsement, advertisement, or offer to buy or sell any securities, franchises, or other financial instruments, particularly in jurisdictions where such activity would be unlawful.
All content is of a general nature and may not address the specific circumstances of any individual or entity. It is not a substitute for professional advice or services. Any actions you take based on the information provided here are strictly at your own risk. You accept full responsibility for any decisions or outcomes arising from your use of this website and agree to release us from any liability in connection with your use of, or reliance upon, the content or products found herein.