
|
Quinstreet ، Inc. (QNST) تقييم DCF |
Fully Editable: Tailor To Your Needs In Excel Or Sheets
Professional Design: Trusted, Industry-Standard Templates
Investor-Approved Valuation Models
MAC/PC Compatible, Fully Unlocked
No Expertise Is Needed; Easy To Follow
QuinStreet, Inc. (QNST) Bundle
اكتسب رؤى حول QuinStreet، Inc. (QNST) تحليل التقييم باستخدام حاسبة DCF المتطورة لدينا! يأتي نموذج Excel هذا محملاً مسبقًا ببيانات حقيقية لـ (QNST)، مما يتيح لك ضبط التوقعات والافتراضات لتحديد القيمة الجوهرية لشركة QuinStreet، Inc.
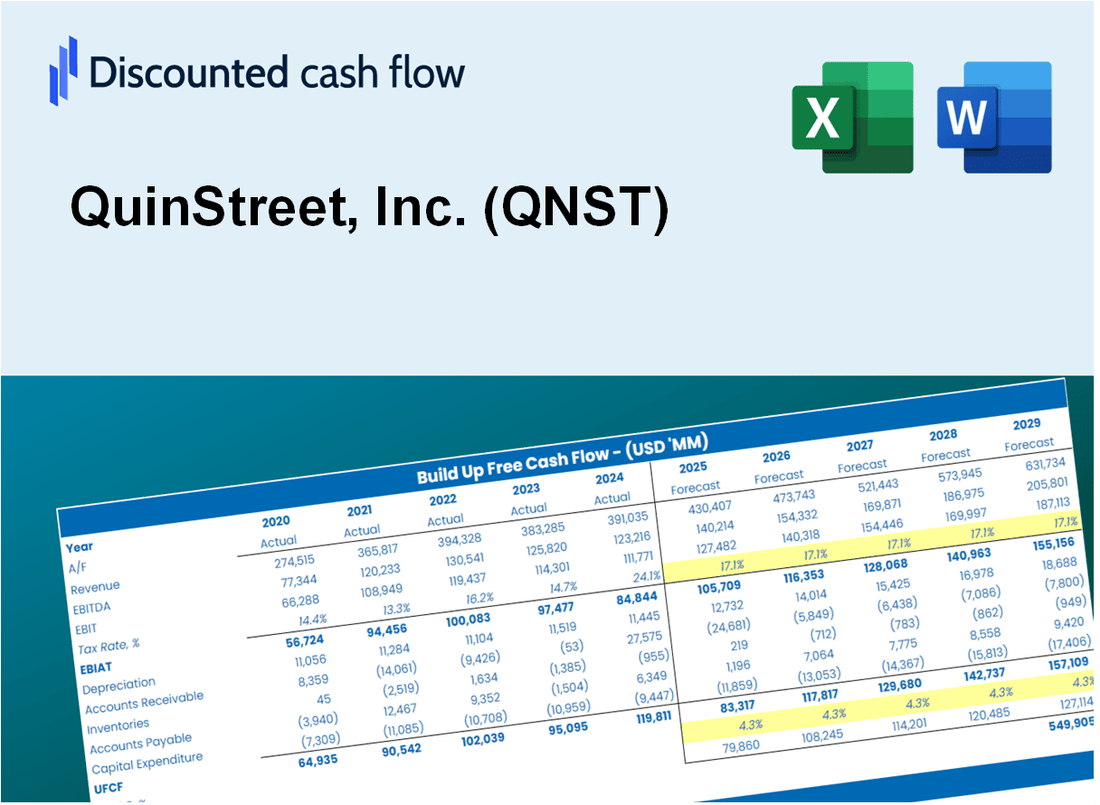
Discounted Cash Flow (DCF) - (USD MM)
| Year | AY1 2021 |
AY2 2022 |
AY3 2023 |
AY4 2024 |
AY5 2025 |
FY1 2026 |
FY2 2027 |
FY3 2028 |
FY4 2029 |
FY5 2030 |
|---|---|---|---|---|---|---|---|---|---|---|
| Revenue | 578.5 | 582.1 | 580.6 | 613.5 | 1,093.7 | 1,324.2 | 1,603.3 | 1,941.2 | 2,350.4 | 2,845.8 |
| Revenue Growth, % | 0 | 0.62439 | -0.25339 | 5.66 | 78.27 | 21.08 | 21.08 | 21.08 | 21.08 | 21.08 |
| EBITDA | 46.8 | 11.2 | -1.4 | -5.8 | 30.5 | 30.8 | 37.3 | 45.2 | 54.7 | 66.2 |
| EBITDA, % | 8.09 | 1.93 | -0.24405 | -0.93869 | 2.79 | 2.33 | 2.33 | 2.33 | 2.33 | 2.33 |
| Depreciation | 16.2 | 15.9 | 19.2 | 24.0 | 24.5 | 39.7 | 48.0 | 58.2 | 70.4 | 85.3 |
| Depreciation, % | 2.8 | 2.73 | 3.3 | 3.9 | 2.24 | 3 | 3 | 3 | 3 | 3 |
| EBIT | 30.6 | -4.7 | -20.6 | -29.7 | 6.0 | -8.9 | -10.7 | -13.0 | -15.7 | -19.0 |
| EBIT, % | 5.29 | -0.80519 | -3.54 | -4.84 | 0.55161 | -0.66925 | -0.66925 | -0.66925 | -0.66925 | -0.66925 |
| Total Cash | 110.3 | 96.4 | 73.7 | 50.5 | 101.1 | 174.3 | 211.0 | 255.5 | 309.3 | 374.5 |
| Total Cash, percent | .0 | .0 | .0 | .0 | .0 | .0 | .0 | .0 | .0 | .0 |
| Account Receivables | 91.5 | 81.6 | 67.9 | 111.8 | 135.8 | 191.1 | 231.4 | 280.2 | 339.2 | 410.7 |
| Account Receivables, % | 15.81 | 14.01 | 11.69 | 18.23 | 12.42 | 14.43 | 14.43 | 14.43 | 14.43 | 14.43 |
| Inventories | .0 | .0 | .0 | .0 | .0 | .0 | .0 | .0 | .0 | .0 |
| Inventories, % | 0 | 0 | 0 | 0 | 0 | 0 | 0 | 0 | 0 | 0 |
| Accounts Payable | 45.2 | 42.4 | 37.9 | 48.2 | 62.2 | 93.2 | 112.8 | 136.6 | 165.4 | 200.3 |
| Accounts Payable, % | 7.82 | 7.29 | 6.53 | 7.86 | 5.69 | 7.04 | 7.04 | 7.04 | 7.04 | 7.04 |
| Capital Expenditure | -2.0 | -7.5 | -15.0 | -5.3 | -2.1 | -14.0 | -16.9 | -20.5 | -24.8 | -30.0 |
| Capital Expenditure, % | -0.34037 | -1.29 | -2.58 | -0.8717 | -0.18936 | -1.06 | -1.06 | -1.06 | -1.06 | -1.06 |
| Tax Rate, % | 16.44 | 16.44 | 16.44 | 16.44 | 16.44 | 16.44 | 16.44 | 16.44 | 16.44 | 16.44 |
| EBITAT | 24.6 | -4.3 | -66.3 | -30.6 | 5.0 | -8.1 | -9.8 | -11.8 | -14.3 | -17.3 |
| Depreciation | ||||||||||
| Changes in Account Receivables | ||||||||||
| Changes in Inventories | ||||||||||
| Changes in Accounts Payable | ||||||||||
| Capital Expenditure | ||||||||||
| UFCF | -7.4 | 11.2 | -53.0 | -45.7 | 17.6 | -6.7 | .7 | .9 | 1.0 | 1.3 |
| WACC, % | 7.18 | 7.18 | 7.19 | 7.19 | 7.18 | 7.18 | 7.18 | 7.18 | 7.18 | 7.18 |
| PV UFCF | ||||||||||
| SUM PV UFCF | -3.3 | |||||||||
| Long Term Growth Rate, % | 3.00 | |||||||||
| Free cash flow (T + 1) | 1 | |||||||||
| Terminal Value | 31 | |||||||||
| Present Terminal Value | 22 | |||||||||
| Enterprise Value | 19 | |||||||||
| Net Debt | -91 | |||||||||
| Equity Value | 110 | |||||||||
| Diluted Shares Outstanding, MM | 58 | |||||||||
| Equity Value Per Share | 1.88 |
What You Will Get
- Real QNST Financial Data: Pre-filled with QuinStreet’s historical and projected data for precise analysis.
- Fully Editable Template: Modify key inputs like revenue growth, WACC, and EBITDA % with ease.
- Automatic Calculations: See QuinStreet’s intrinsic value update instantly based on your changes.
- Professional Valuation Tool: Designed for investors, analysts, and consultants seeking accurate DCF results.
- User-Friendly Design: Simple structure and clear instructions for all experience levels.
Key Features
- Customizable Revenue Inputs: Adjust essential metrics like lead generation rates, customer acquisition costs, and advertising spend.
- Instant DCF Valuation: Provides immediate calculations of intrinsic value, NPV, and other key financial outputs.
- High-Precision Accuracy: Incorporates QuinStreet's actual financial data for credible valuation results.
- Effortless Scenario Analysis: Easily evaluate various assumptions and analyze different outcomes.
- Efficiency Booster: Avoid the hassle of creating intricate valuation models from the ground up.
How It Works
- Step 1: Download the Excel file.
- Step 2: Review pre-entered QuinStreet data (historical and projected).
- Step 3: Adjust key assumptions (yellow cells) based on your analysis.
- Step 4: View automatic recalculations for QuinStreet’s intrinsic value.
- Step 5: Use the outputs for investment decisions or reporting.
Why Choose This Calculator for QuinStreet, Inc. (QNST)?
- Accurate Data: Access to real QuinStreet financials guarantees dependable valuation outcomes.
- Customizable: Tailor essential parameters like growth rates, WACC, and tax rates to fit your forecasts.
- Time-Saving: Ready-made calculations save you the hassle of starting from the ground up.
- Professional-Grade Tool: Crafted for investors, analysts, and consultants in the finance sector.
- User-Friendly: Easy-to-navigate layout and step-by-step guidance make it accessible for everyone.
Who Should Use This Product?
- Marketing Professionals: Discover effective strategies and apply them using real-world case studies.
- Researchers: Utilize industry-leading models to enhance your academic projects or papers.
- Investors: Evaluate your investment strategies and assess market trends related to QuinStreet, Inc. (QNST).
- Data Analysts: Optimize your analysis process with an intuitive, customizable data model.
- Entrepreneurs: Understand how digital marketing companies like QuinStreet, Inc. (QNST) operate and grow.
What the Template Contains
- Operating and Balance Sheet Data: Pre-filled QuinStreet historical data and forecasts, including revenue, EBITDA, EBIT, and capital expenditures.
- WACC Calculation: A dedicated sheet for Weighted Average Cost of Capital (WACC), including parameters like Beta, risk-free rate, and share price.
- DCF Valuation (Unlevered and Levered): Editable Discounted Cash Flow models showing intrinsic value with detailed calculations.
- Financial Statements: Pre-loaded financial statements (annual and quarterly) to support analysis.
- Key Ratios: Includes profitability, leverage, and efficiency ratios for QuinStreet, Inc. (QNST).
- Dashboard and Charts: Visual summary of valuation outputs and assumptions to analyze results easily.
Disclaimer
All information, articles, and product details provided on this website are for general informational and educational purposes only. We do not claim any ownership over, nor do we intend to infringe upon, any trademarks, copyrights, logos, brand names, or other intellectual property mentioned or depicted on this site. Such intellectual property remains the property of its respective owners, and any references here are made solely for identification or informational purposes, without implying any affiliation, endorsement, or partnership.
We make no representations or warranties, express or implied, regarding the accuracy, completeness, or suitability of any content or products presented. Nothing on this website should be construed as legal, tax, investment, financial, medical, or other professional advice. In addition, no part of this site—including articles or product references—constitutes a solicitation, recommendation, endorsement, advertisement, or offer to buy or sell any securities, franchises, or other financial instruments, particularly in jurisdictions where such activity would be unlawful.
All content is of a general nature and may not address the specific circumstances of any individual or entity. It is not a substitute for professional advice or services. Any actions you take based on the information provided here are strictly at your own risk. You accept full responsibility for any decisions or outcomes arising from your use of this website and agree to release us from any liability in connection with your use of, or reliance upon, the content or products found herein.