
|
Ryder System ، Inc. (R) DCF تقييم |
Fully Editable: Tailor To Your Needs In Excel Or Sheets
Professional Design: Trusted, Industry-Standard Templates
Investor-Approved Valuation Models
MAC/PC Compatible, Fully Unlocked
No Expertise Is Needed; Easy To Follow
Ryder System, Inc. (R) Bundle
سواء كنت مستثمرًا أو محللًا ، فإن حاسبة DCF (R) هذه هي الأداة المثالية للتقييم الدقيق. تم تحميلها مسبقًا مع بيانات Ryder System ، Inc. ، يمكنك ضبط التنبؤات ومراقبة التأثيرات في الوقت الفعلي.
What You Will Receive
- Customizable Excel Template: A fully adaptable Excel-based DCF Calculator featuring pre-filled real Ryder System, Inc. (R) financials.
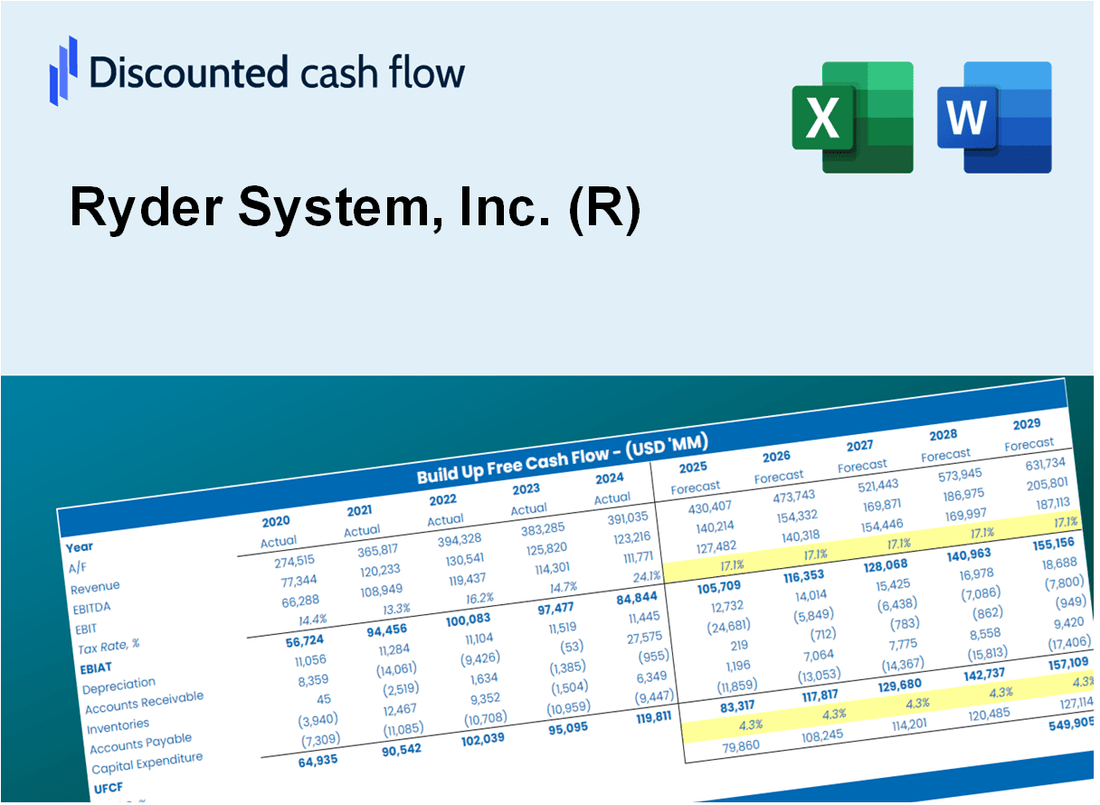
- Authentic Data: Historical figures and forward-looking projections (highlighted in the yellow cells).
- Flexible Forecasting: Adjust forecast parameters such as revenue growth, EBITDA %, and WACC.
- Instant Calculations: Quickly observe how your inputs affect Ryder System, Inc. (R)'s valuation.
- Professional Resource: Designed for investors, CFOs, consultants, and financial analysts.
- Intuitive Layout: Organized for clarity and simplicity, complete with step-by-step guidance.
Key Features
- 🔍 Real-Life R Financials: Pre-filled historical and projected data for Ryder System, Inc. (R).
- ✏️ Fully Customizable Inputs: Adjust all critical parameters (yellow cells) like WACC, growth %, and tax rates.
- 📊 Professional DCF Valuation: Built-in formulas calculate Ryder’s intrinsic value using the Discounted Cash Flow method.
- ⚡ Instant Results: Visualize Ryder’s valuation instantly after making changes.
- Scenario Analysis: Test and compare outcomes for various financial assumptions side-by-side.
How It Works
- Step 1: Download the Excel file.
- Step 2: Review pre-entered Ryder System, Inc. (R) data (historical and projected).
- Step 3: Adjust key assumptions (yellow cells) based on your analysis.
- Step 4: View automatic recalculations for Ryder System, Inc. (R)’s intrinsic value.
- Step 5: Use the outputs for investment decisions or reporting.
Why Choose Ryder System, Inc. (R)?
- Accuracy: Reliable data sourced from Ryder's financials ensures precision.
- Flexibility: Tailored for users to easily adjust and experiment with inputs.
- Time-Saving: Eliminate the need to create a financial model from the ground up.
- Professional-Grade: Crafted with the expertise and usability expected at the CFO level.
- User-Friendly: Intuitive design makes it accessible for users without extensive financial modeling knowledge.
Who Should Use This Product?
- Individual Investors: Make informed decisions about buying or selling Ryder System, Inc. (R) stock.
- Financial Analysts: Streamline valuation processes with ready-to-use financial models tailored for Ryder System, Inc. (R).
- Consultants: Deliver professional valuation insights on Ryder System, Inc. (R) to clients quickly and accurately.
- Business Owners: Understand how companies like Ryder System, Inc. (R) are valued to guide your own business strategy.
- Finance Students: Learn valuation techniques using real-world data and scenarios related to Ryder System, Inc. (R).
What the Template Contains
- Comprehensive DCF Model: Editable template with detailed valuation calculations for Ryder System, Inc. (R).
- Real-World Data: Ryder’s historical and projected financials preloaded for analysis.
- Customizable Parameters: Adjust WACC, growth rates, and tax assumptions to test various scenarios.
- Financial Statements: Complete annual and quarterly breakdowns for deeper insights into Ryder's performance.
- Key Ratios: Built-in analysis for profitability, efficiency, and leverage specific to Ryder System, Inc. (R).
- Dashboard with Visual Outputs: Charts and tables for clear, actionable results tailored to Ryder's data.
Disclaimer
All information, articles, and product details provided on this website are for general informational and educational purposes only. We do not claim any ownership over, nor do we intend to infringe upon, any trademarks, copyrights, logos, brand names, or other intellectual property mentioned or depicted on this site. Such intellectual property remains the property of its respective owners, and any references here are made solely for identification or informational purposes, without implying any affiliation, endorsement, or partnership.
We make no representations or warranties, express or implied, regarding the accuracy, completeness, or suitability of any content or products presented. Nothing on this website should be construed as legal, tax, investment, financial, medical, or other professional advice. In addition, no part of this site—including articles or product references—constitutes a solicitation, recommendation, endorsement, advertisement, or offer to buy or sell any securities, franchises, or other financial instruments, particularly in jurisdictions where such activity would be unlawful.
All content is of a general nature and may not address the specific circumstances of any individual or entity. It is not a substitute for professional advice or services. Any actions you take based on the information provided here are strictly at your own risk. You accept full responsibility for any decisions or outcomes arising from your use of this website and agree to release us from any liability in connection with your use of, or reliance upon, the content or products found herein.