
|
Ready Capital Corporation (RC) تقييم DCF |
Fully Editable: Tailor To Your Needs In Excel Or Sheets
Professional Design: Trusted, Industry-Standard Templates
Investor-Approved Valuation Models
MAC/PC Compatible, Fully Unlocked
No Expertise Is Needed; Easy To Follow
Ready Capital Corporation (RC) Bundle
تبحث لتحديد القيمة الجوهرية لشركة Ready Capital Corporation؟ يدمج حاسبة DCF (RC) DCF بيانات العالم الحقيقي مع ميزات تخصيص واسعة ، مما يتيح لك ضبط التوقعات وتعزيز قراراتك الاستثمارية.
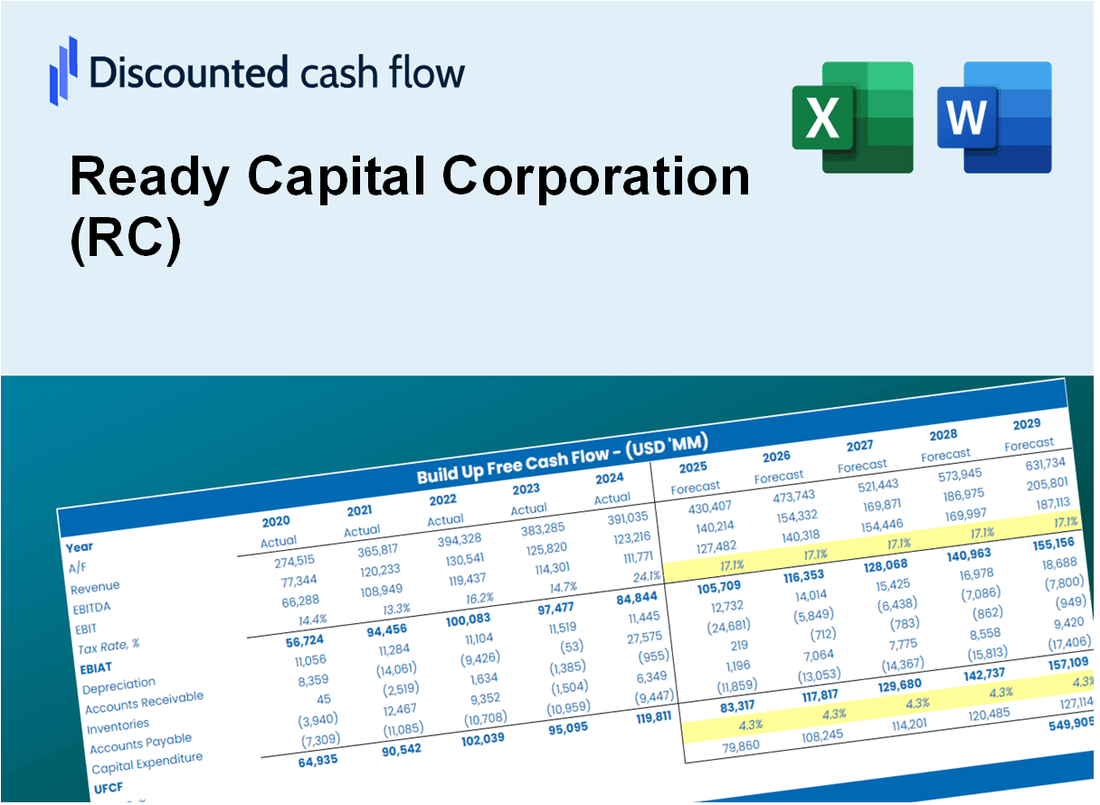
Discounted Cash Flow (DCF) - (USD MM)
| Year | AY1 2020 |
AY2 2021 |
AY3 2022 |
AY4 2023 |
AY5 2024 |
FY1 2025 |
FY2 2026 |
FY3 2027 |
FY4 2028 |
FY5 2029 |
|---|---|---|---|---|---|---|---|---|---|---|
| Revenue | 384.7 | 296.3 | 383.3 | 389.9 | 27.4 | 21.6 | 17.0 | 13.4 | 10.5 | 8.3 |
| Revenue Growth, % | 0 | -22.96 | 29.36 | 1.72 | -92.99 | -21.22 | -21.22 | -21.22 | -21.22 | -21.22 |
| EBITDA | .0 | .0 | .0 | .0 | .0 | .0 | .0 | .0 | .0 | .0 |
| EBITDA, % | 0 | 0 | 0 | 0 | 0 | 0 | 0 | 0 | 0 | 0 |
| Depreciation | .0 | .0 | .0 | .0 | .0 | .0 | .0 | .0 | .0 | .0 |
| Depreciation, % | 0 | 0 | 0 | 0 | 0 | 0 | 0 | 0 | 0 | 0 |
| EBIT | .0 | .0 | .0 | .0 | .0 | .0 | .0 | .0 | .0 | .0 |
| EBIT, % | 0 | 0 | 0 | 0 | 0 | 0 | 0 | 0 | 0 | 0 |
| Total Cash | .0 | 229.5 | 281.7 | 148.3 | 143.8 | 12.5 | 9.8 | 7.7 | 6.1 | 4.8 |
| Total Cash, percent | .0 | .0 | .0 | .0 | .0 | .0 | .0 | .0 | .0 | .0 |
| Account Receivables | 41.1 | 82.8 | 10,080.2 | 131.3 | 247.6 | 11.7 | 9.2 | 7.3 | 5.7 | 4.5 |
| Account Receivables, % | 10.69 | 27.93 | 2629.62 | 33.67 | 905.24 | 54.46 | 54.46 | 54.46 | 54.46 | 54.46 |
| Inventories | .0 | -53.3 | 117.1 | -129.9 | .0 | -.9 | -.7 | -.6 | -.4 | -.3 |
| Inventories, % | 0 | -17.99 | 30.55 | -33.32 | 0 | -4.15 | -4.15 | -4.15 | -4.15 | -4.15 |
| Accounts Payable | 27.0 | 41.4 | 47.9 | 41.6 | 53.3 | 6.2 | 4.9 | 3.9 | 3.0 | 2.4 |
| Accounts Payable, % | 7.02 | 13.96 | 12.51 | 10.67 | 194.97 | 28.83 | 28.83 | 28.83 | 28.83 | 28.83 |
| Capital Expenditure | .0 | -3,704.8 | .0 | .0 | .0 | -4.3 | -3.4 | -2.7 | -2.1 | -1.7 |
| Capital Expenditure, % | 0 | -1250.21 | 0 | 0 | 0 | -20 | -20 | -20 | -20 | -20 |
| Tax Rate, % | 15.63 | 15.63 | 15.63 | 15.63 | 15.63 | 15.63 | 15.63 | 15.63 | 15.63 | 15.63 |
| EBITAT | .0 | .0 | .0 | .0 | .0 | .0 | .0 | .0 | .0 | .0 |
| Depreciation | ||||||||||
| Changes in Account Receivables | ||||||||||
| Changes in Inventories | ||||||||||
| Changes in Accounts Payable | ||||||||||
| Capital Expenditure | ||||||||||
| UFCF | -14.1 | -3,678.8 | -10,161.3 | 10,189.6 | -234.5 | 185.3 | -2.4 | -1.9 | -1.5 | -1.2 |
| WACC, % | 9.59 | 11.48 | 11.48 | 10.91 | 9.8 | 10.66 | 10.66 | 10.66 | 10.66 | 10.66 |
| PV UFCF | ||||||||||
| SUM PV UFCF | 162.4 | |||||||||
| Long Term Growth Rate, % | 2.00 | |||||||||
| Free cash flow (T + 1) | -1 | |||||||||
| Terminal Value | -14 | |||||||||
| Present Terminal Value | -8 | |||||||||
| Enterprise Value | 154 | |||||||||
| Net Debt | 5,891 | |||||||||
| Equity Value | -5,737 | |||||||||
| Diluted Shares Outstanding, MM | 170 | |||||||||
| Equity Value Per Share | -33.66 |
What You Will Get
- Comprehensive RC Data: Preloaded financials – from revenue to EBIT – based on actual and projected figures for Ready Capital Corporation (RC).
- Full Customization: Adjust all critical parameters (yellow cells) like WACC, growth %, and tax rates to fit your analysis.
- Instant Valuation Updates: Automatic recalculations to analyze the impact of changes on Ready Capital Corporation’s (RC) fair value.
- Versatile Excel Template: Designed for quick edits, scenario testing, and detailed projections tailored to Ready Capital Corporation (RC).
- Time-Saving and Accurate: Avoid building models from scratch while ensuring precision and flexibility in your evaluations.
Key Features
- Real-Life RC Data: Pre-filled with Ready Capital Corporation’s historical financials and forward-looking projections.
- Fully Customizable Inputs: Adjust revenue growth, margins, WACC, tax rates, and capital expenditures.
- Dynamic Valuation Model: Automatic updates to Net Present Value (NPV) and intrinsic value based on your inputs.
- Scenario Testing: Create multiple forecast scenarios to analyze different valuation outcomes.
- User-Friendly Design: Simple, structured, and designed for professionals and beginners alike.
How It Works
- Step 1: Download the prebuilt Excel template containing Ready Capital Corporation's (RC) data.
- Step 2: Navigate through the pre-filled sheets to familiarize yourself with the essential metrics.
- Step 3: Modify forecasts and assumptions in the editable yellow cells (WACC, growth, margins).
- Step 4: Instantly see the updated results, including Ready Capital Corporation's (RC) intrinsic value.
- Step 5: Utilize the outputs to make informed investment choices or create comprehensive reports.
Why Choose Ready Capital Corporation (RC)?
- Comprehensive Services: Offers a full suite of financing solutions, including bridge loans and commercial mortgages.
- Tailored Solutions: Customize financing options to meet specific business needs and objectives.
- Expert Insights: Provides in-depth market analysis and investment strategies for optimal returns.
- Reliable Data: Utilizes both historical and projected financial data to inform decision-making.
- Professional Standards: Trusted by investors, real estate professionals, and business owners for high-quality service.
Who Should Use Ready Capital Corporation (RC)?
- Investors: Evaluate Ready Capital’s performance before making investment decisions.
- CFOs and Financial Analysts: Optimize valuation methodologies and assess financial forecasts.
- Startup Founders: Understand the valuation strategies of established financial firms like Ready Capital.
- Consultants: Provide detailed valuation analyses and reports for clients seeking funding.
- Students and Educators: Utilize current financial data to learn and teach valuation principles.
What the Template Contains
- Pre-Filled DCF Model: Ready Capital Corporation’s (RC) financial data preloaded for immediate use.
- WACC Calculator: Detailed calculations for Weighted Average Cost of Capital.
- Financial Ratios: Evaluate Ready Capital Corporation’s (RC) profitability, leverage, and efficiency.
- Editable Inputs: Change assumptions such as growth, margins, and CAPEX to fit your scenarios.
- Financial Statements: Annual and quarterly reports to support detailed analysis.
- Interactive Dashboard: Easily visualize key valuation metrics and results.
Disclaimer
All information, articles, and product details provided on this website are for general informational and educational purposes only. We do not claim any ownership over, nor do we intend to infringe upon, any trademarks, copyrights, logos, brand names, or other intellectual property mentioned or depicted on this site. Such intellectual property remains the property of its respective owners, and any references here are made solely for identification or informational purposes, without implying any affiliation, endorsement, or partnership.
We make no representations or warranties, express or implied, regarding the accuracy, completeness, or suitability of any content or products presented. Nothing on this website should be construed as legal, tax, investment, financial, medical, or other professional advice. In addition, no part of this site—including articles or product references—constitutes a solicitation, recommendation, endorsement, advertisement, or offer to buy or sell any securities, franchises, or other financial instruments, particularly in jurisdictions where such activity would be unlawful.
All content is of a general nature and may not address the specific circumstances of any individual or entity. It is not a substitute for professional advice or services. Any actions you take based on the information provided here are strictly at your own risk. You accept full responsibility for any decisions or outcomes arising from your use of this website and agree to release us from any liability in connection with your use of, or reliance upon, the content or products found herein.