
|
Redfin Corporation (RDFN) DCF تقييم |
Fully Editable: Tailor To Your Needs In Excel Or Sheets
Professional Design: Trusted, Industry-Standard Templates
Investor-Approved Valuation Models
MAC/PC Compatible, Fully Unlocked
No Expertise Is Needed; Easy To Follow
Redfin Corporation (RDFN) Bundle
تقييم التوقعات المالية لشركة Redfin (RDFN) مثل خبير! توفر لك حاسبة DCF (RDFN) هذه المالية المملوءة مسبقًا مع السماح لك بالحرية في تعديل نمو الإيرادات ، WACC ، الهوامش ، وغيرها من الافتراضات الأساسية التي تتماشى مع تنبؤاتك.
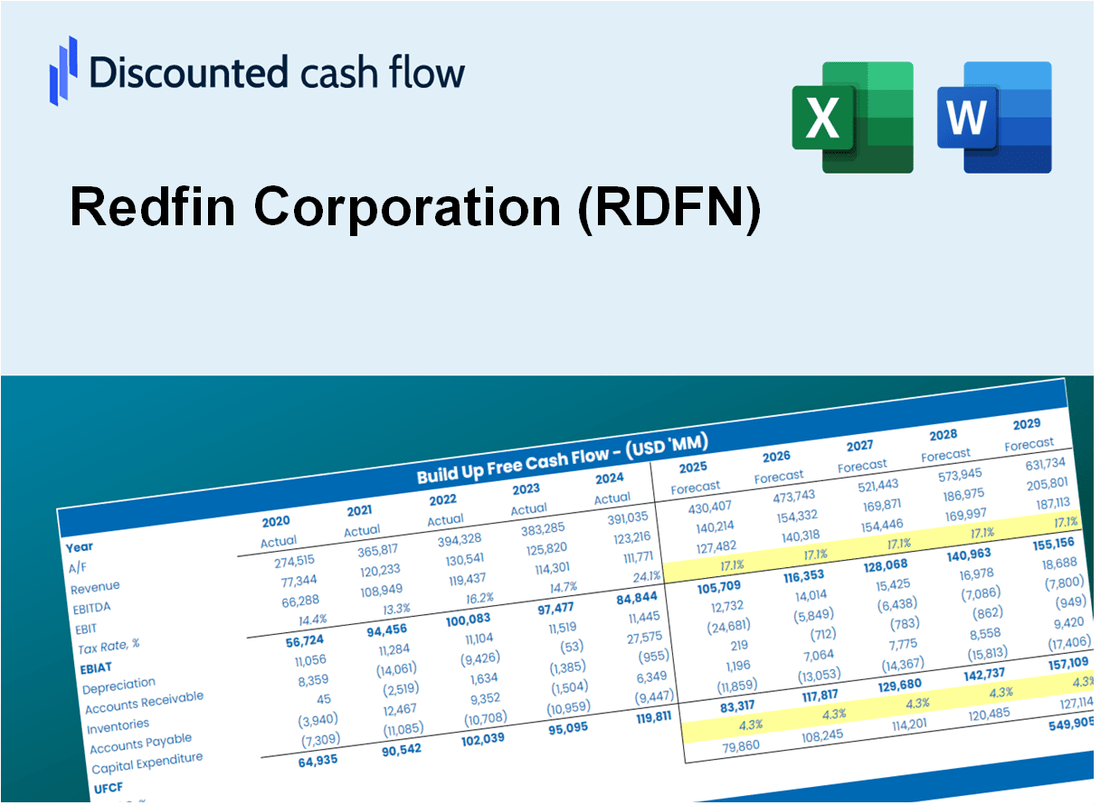
Discounted Cash Flow (DCF) - (USD MM)
| Year | AY1 2020 |
AY2 2021 |
AY3 2022 |
AY4 2023 |
AY5 2024 |
FY1 2025 |
FY2 2026 |
FY3 2027 |
FY4 2028 |
FY5 2029 |
|---|---|---|---|---|---|---|---|---|---|---|
| Revenue | 886.1 | 1,922.8 | 2,284.4 | 976.7 | 1,043.0 | 1,221.2 | 1,429.9 | 1,674.2 | 1,960.3 | 2,295.3 |
| Revenue Growth, % | 0 | 116.99 | 18.81 | -57.25 | 6.79 | 17.09 | 17.09 | 17.09 | 17.09 | 17.09 |
| EBITDA | 21.9 | -42.9 | -175.9 | -53.0 | -106.8 | -56.5 | -66.2 | -77.5 | -90.7 | -106.2 |
| EBITDA, % | 2.47 | -2.23 | -7.7 | -5.43 | -10.24 | -4.63 | -4.63 | -4.63 | -4.63 | -4.63 |
| Depreciation | 877.4 | 2,024.8 | 1,365.6 | 62.8 | 42.8 | 657.8 | 770.2 | 901.8 | 1,055.9 | 1,236.4 |
| Depreciation, % | 99.02 | 105.31 | 59.78 | 6.43 | 4.1 | 53.87 | 53.87 | 53.87 | 53.87 | 53.87 |
| EBIT | -855.6 | -2,067.7 | -1,541.5 | -115.8 | -149.6 | -708.9 | -830.0 | -971.8 | -1,137.9 | -1,332.3 |
| EBIT, % | -96.55 | -107.54 | -67.48 | -11.86 | -14.34 | -58.05 | -58.05 | -58.05 | -58.05 | -58.05 |
| Total Cash | 1,056.8 | 624.7 | 362.1 | 191.7 | 124.7 | 439.5 | 514.6 | 602.5 | 705.4 | 826.0 |
| Total Cash, percent | .0 | .0 | .0 | .0 | .0 | .0 | .0 | .0 | .0 | .0 |
| Account Receivables | 54.7 | 69.6 | 46.4 | 51.7 | 48.7 | 53.2 | 62.3 | 73.0 | 85.4 | 100.0 |
| Account Receivables, % | 6.18 | 3.62 | 2.03 | 5.3 | 4.67 | 4.36 | 4.36 | 4.36 | 4.36 | 4.36 |
| Inventories | 49.2 | 358.2 | 114.3 | .0 | .0 | 71.3 | 83.4 | 97.7 | 114.4 | 134.0 |
| Inventories, % | 5.55 | 18.63 | 5 | 0 | 0 | 5.84 | 5.84 | 5.84 | 5.84 | 5.84 |
| Accounts Payable | 5.6 | 12.5 | 11.1 | 10.5 | 16.8 | 10.9 | 12.8 | 15.0 | 17.5 | 20.5 |
| Accounts Payable, % | 0.63695 | 0.6525 | 0.48436 | 1.08 | 1.62 | 0.89298 | 0.89298 | 0.89298 | 0.89298 | 0.89298 |
| Capital Expenditure | -14.7 | -27.5 | -21.5 | -12.1 | -11.2 | -15.5 | -18.1 | -21.2 | -24.9 | -29.1 |
| Capital Expenditure, % | -1.66 | -1.43 | -0.94251 | -1.23 | -1.07 | -1.27 | -1.27 | -1.27 | -1.27 | -1.27 |
| Tax Rate, % | 0.32057 | 0.32057 | 0.32057 | 0.32057 | 0.32057 | 0.32057 | 0.32057 | 0.32057 | 0.32057 | 0.32057 |
| EBITAT | -1,668.2 | -1,958.6 | -1,542.1 | -120.1 | -149.1 | -700.9 | -820.7 | -960.9 | -1,125.2 | -1,317.4 |
| Depreciation | ||||||||||
| Changes in Account Receivables | ||||||||||
| Changes in Inventories | ||||||||||
| Changes in Accounts Payable | ||||||||||
| Capital Expenditure | ||||||||||
| UFCF | -903.7 | -278.3 | 67.7 | 39.0 | -108.2 | -140.3 | -88.0 | -103.1 | -120.7 | -141.3 |
| WACC, % | 10.44 | 10.35 | 10.44 | 10.44 | 10.43 | 10.42 | 10.42 | 10.42 | 10.42 | 10.42 |
| PV UFCF | ||||||||||
| SUM PV UFCF | -443.1 | |||||||||
| Long Term Growth Rate, % | 2.00 | |||||||||
| Free cash flow (T + 1) | -144 | |||||||||
| Terminal Value | -1,711 | |||||||||
| Present Terminal Value | -1,043 | |||||||||
| Enterprise Value | -1,486 | |||||||||
| Net Debt | 870 | |||||||||
| Equity Value | -2,356 | |||||||||
| Diluted Shares Outstanding, MM | 122 | |||||||||
| Equity Value Per Share | -19.36 |
What You Will Receive
- Customizable Excel Template: A fully adaptable Excel-based DCF Calculator featuring real financial data for Redfin Corporation (RDFN).
- Accurate Data: Historical financial figures and future projections (highlighted in the yellow cells).
- Adjustable Forecasts: Modify assumptions such as revenue growth, EBITDA %, and WACC as needed.
- Instant Calculations: Quickly observe how your inputs affect Redfin's valuation.
- Professional Resource: Designed for investors, CFOs, consultants, and financial analysts.
- Intuitive Layout: Organized for simplicity and user-friendliness, complete with step-by-step guidance.
Key Features
- Comprehensive RDFN Data: Pre-populated with Redfin’s historical performance metrics and future projections.
- Flexible Input Options: Modify key parameters such as revenue growth rates, profit margins, discount rates, tax implications, and capital investments.
- Interactive Valuation Model: Instant updates to Net Present Value (NPV) and intrinsic value based on user-defined parameters.
- Scenario Analysis: Develop various forecasting scenarios to evaluate different valuation results.
- Intuitive Interface: A clean, organized layout suitable for both experienced users and newcomers.
How It Works
- Download: Get the pre-built Excel file featuring Redfin Corporation's (RDFN) financial data.
- Customize: Modify projections, including revenue growth, EBITDA %, and WACC.
- Update Automatically: The intrinsic value and NPV calculations refresh in real-time.
- Test Scenarios: Develop various forecasts and instantly compare results.
- Make Decisions: Utilize the valuation insights to inform your investment approach.
Why Choose Redfin Corporation (RDFN)?
- Streamlined Home Buying: Access a user-friendly platform that simplifies the real estate process.
- Accurate Listings: Up-to-date property data ensures you have the most reliable information at your fingertips.
- Personalized Experience: Customize your search to find homes that meet your unique preferences and needs.
- Visual Insights: Engaging maps and visuals make it easy to understand market trends and property values.
- Endorsed by Homebuyers: Trusted by thousands of clients for its commitment to transparency and service.
Who Should Use This Product?
- Individual Homebuyers: Make informed decisions about purchasing or selling properties through Redfin's insights.
- Real Estate Agents: Enhance client offerings with comprehensive market analysis and tools from Redfin.
- Investors: Gain valuable data and trends to assess the potential of investing in real estate markets.
- Home Sellers: Understand market dynamics and pricing strategies to optimize your sale process.
- Real Estate Students: Explore practical applications of real estate valuation using current market data.
What the Template Contains
- Pre-Filled Data: Includes Redfin Corporation’s historical financials and forecasts.
- Discounted Cash Flow Model: Editable DCF valuation model with automatic calculations.
- Weighted Average Cost of Capital (WACC): A dedicated sheet for calculating WACC based on custom inputs.
- Key Financial Ratios: Analyze Redfin Corporation’s profitability, efficiency, and leverage.
- Customizable Inputs: Edit revenue growth, margins, and tax rates with ease.
- Clear Dashboard: Charts and tables summarizing key valuation results.
Disclaimer
All information, articles, and product details provided on this website are for general informational and educational purposes only. We do not claim any ownership over, nor do we intend to infringe upon, any trademarks, copyrights, logos, brand names, or other intellectual property mentioned or depicted on this site. Such intellectual property remains the property of its respective owners, and any references here are made solely for identification or informational purposes, without implying any affiliation, endorsement, or partnership.
We make no representations or warranties, express or implied, regarding the accuracy, completeness, or suitability of any content or products presented. Nothing on this website should be construed as legal, tax, investment, financial, medical, or other professional advice. In addition, no part of this site—including articles or product references—constitutes a solicitation, recommendation, endorsement, advertisement, or offer to buy or sell any securities, franchises, or other financial instruments, particularly in jurisdictions where such activity would be unlawful.
All content is of a general nature and may not address the specific circumstances of any individual or entity. It is not a substitute for professional advice or services. Any actions you take based on the information provided here are strictly at your own risk. You accept full responsibility for any decisions or outcomes arising from your use of this website and agree to release us from any liability in connection with your use of, or reliance upon, the content or products found herein.