
|
حدود الأبحاث دمج (ARBL) تقييم DCF |
Fully Editable: Tailor To Your Needs In Excel Or Sheets
Professional Design: Trusted, Industry-Standard Templates
Investor-Approved Valuation Models
MAC/PC Compatible, Fully Unlocked
No Expertise Is Needed; Easy To Follow
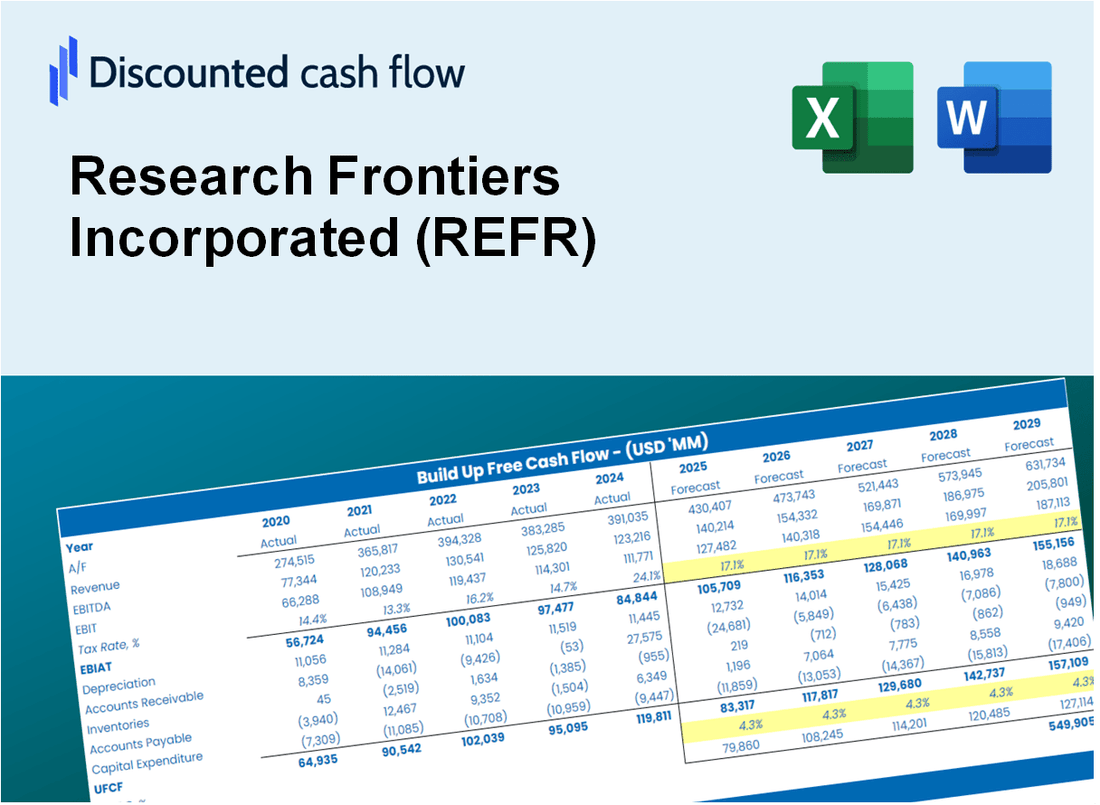
Research Frontiers Incorporated (REFR) Bundle
سواء كنت مستثمرًا أو محللًا ، فإن آلة حاسبة DCF هذه هي موردك للتقييم الدقيق. مزودة ببيانات حقيقية من Frontiers Research Incorporated ، يمكنك ضبط التوقعات ومراقبة التأثيرات في الوقت الفعلي.
Discounted Cash Flow (DCF) - (USD MM)
| Year | AY1 2020 |
AY2 2021 |
AY3 2022 |
AY4 2023 |
AY5 2024 |
FY1 2025 |
FY2 2026 |
FY3 2027 |
FY4 2028 |
FY5 2029 |
|---|---|---|---|---|---|---|---|---|---|---|
| Revenue | .8 | 1.3 | .5 | .9 | 1.3 | 1.7 | 2.2 | 2.8 | 3.5 | 4.5 |
| Revenue Growth, % | 0 | 52.46 | -57.27 | 68.54 | 46.83 | 27.64 | 27.64 | 27.64 | 27.64 | 27.64 |
| EBITDA | -2.5 | -1.7 | -2.4 | -1.9 | -1.2 | -1.7 | -2.1 | -2.7 | -3.5 | -4.4 |
| EBITDA, % | -303.01 | -131.61 | -453.96 | -204.61 | -88.23 | -97.65 | -97.65 | -97.65 | -97.65 | -97.65 |
| Depreciation | .1 | .2 | .2 | .2 | .3 | .3 | .4 | .5 | .7 | .8 |
| Depreciation, % | 8.1 | 13.98 | 32.45 | 18.93 | 19.73 | 18.64 | 18.64 | 18.64 | 18.64 | 18.64 |
| EBIT | -2.6 | -1.8 | -2.6 | -2.0 | -1.4 | -1.7 | -2.2 | -2.8 | -3.5 | -4.5 |
| EBIT, % | -311.11 | -145.59 | -486.42 | -223.54 | -107.96 | -100 | -100 | -100 | -100 | -100 |
| Total Cash | 4.8 | 3.0 | 4.2 | 2.5 | 2.0 | 1.7 | 2.2 | 2.8 | 3.5 | 4.5 |
| Total Cash, percent | .0 | .0 | .0 | .0 | .0 | .0 | .0 | .0 | .0 | .0 |
| Account Receivables | .6 | .8 | .6 | 1.0 | .7 | 1.3 | 1.7 | 2.2 | 2.7 | 3.5 |
| Account Receivables, % | 72.22 | 65.84 | 109.25 | 110.31 | 49.28 | 77.47 | 77.47 | 77.47 | 77.47 | 77.47 |
| Inventories | .0 | .0 | .0 | .0 | .0 | .0 | .0 | .0 | .0 | .0 |
| Inventories, % | 0 | 0 | 0 | 0 | 0 | 0 | 0 | 0 | 0 | 0 |
| Accounts Payable | .0 | .1 | .1 | .1 | .1 | .1 | .2 | .2 | .2 | .3 |
| Accounts Payable, % | 4.03 | 5.26 | 13.17 | 5.59 | 6.43 | 6.9 | 6.9 | 6.9 | 6.9 | 6.9 |
| Capital Expenditure | -.1 | .0 | .0 | .0 | .0 | .0 | .0 | .0 | -.1 | -.1 |
| Capital Expenditure, % | -6.82 | -0.08527086 | -0.23551 | -0.17128 | -0.12152 | -1.49 | -1.49 | -1.49 | -1.49 | -1.49 |
| Tax Rate, % | 0 | 0 | 0 | 0 | 0 | 0 | 0 | 0 | 0 | 0 |
| EBITAT | -2.6 | -1.8 | -2.6 | -2.0 | -1.4 | -1.7 | -2.2 | -2.8 | -3.5 | -4.5 |
| Depreciation | ||||||||||
| Changes in Account Receivables | ||||||||||
| Changes in Inventories | ||||||||||
| Changes in Accounts Payable | ||||||||||
| Capital Expenditure | ||||||||||
| UFCF | -3.1 | -1.9 | -2.2 | -2.3 | -.8 | -2.0 | -2.1 | -2.7 | -3.5 | -4.4 |
| WACC, % | 4.96 | 4.96 | 4.96 | 4.96 | 4.96 | 4.96 | 4.96 | 4.96 | 4.96 | 4.96 |
| PV UFCF | ||||||||||
| SUM PV UFCF | -12.6 | |||||||||
| Long Term Growth Rate, % | 2.00 | |||||||||
| Free cash flow (T + 1) | -5 | |||||||||
| Terminal Value | -153 | |||||||||
| Present Terminal Value | -120 | |||||||||
| Enterprise Value | -133 | |||||||||
| Net Debt | -1 | |||||||||
| Equity Value | -132 | |||||||||
| Diluted Shares Outstanding, MM | 34 | |||||||||
| Equity Value Per Share | -3.94 |
What You Will Get
- Real REFR Financials: Access to historical and projected data for precise valuation.
- Customizable Inputs: Adjust WACC, tax rates, revenue growth, and capital expenditures as needed.
- Dynamic Calculations: Intrinsic value and NPV are computed in real-time.
- Scenario Analysis: Explore various scenarios to assess Research Frontiers' future performance.
- User-Friendly Design: Designed for professionals but easy to navigate for newcomers.
Key Features
- Comprehensive REFR Financials: Gain access to precise pre-loaded historical data and future forecasts.
- Adjustable Forecast Parameters: Modify yellow-highlighted fields such as WACC, growth rates, and profit margins.
- Real-Time Calculations: Automatic updates for DCF, Net Present Value (NPV), and cash flow assessments.
- Interactive Dashboard: User-friendly charts and summaries to help visualize your valuation outcomes.
- Designed for All Levels: A straightforward, intuitive layout tailored for investors, CFOs, and consultants.
How It Operates
- Download: Obtain the pre-configured Excel file containing Research Frontiers Incorporated’s (REFR) financial data.
- Customize: Modify projections, such as revenue growth, EBITDA %, and WACC.
- Update Automatically: The intrinsic value and NPV calculations refresh in real-time.
- Test Scenarios: Develop various forecasts and instantly compare results.
- Make Decisions: Leverage the valuation findings to inform your investment strategy.
Why Choose This Calculator for Research Frontiers Incorporated (REFR)?
- Accuracy: Utilizes authentic Research Frontiers financial data for precise calculations.
- Flexibility: Allows users to easily adjust and test various input parameters.
- Time-Saving: Eliminate the need to create a DCF model from the ground up.
- Professional-Grade: Crafted with the expertise and usability expected by CFOs.
- User-Friendly: Intuitive interface suitable for all users, regardless of financial modeling expertise.
Who Should Use This Product?
- Investors: Accurately assess Research Frontiers Incorporated’s (REFR) fair value prior to making investment choices.
- CFOs: Utilize a top-tier DCF model for comprehensive financial reporting and analysis.
- Consultants: Easily modify the template for client valuation reports specific to (REFR).
- Entrepreneurs: Acquire knowledge of financial modeling techniques employed by leading companies.
- Educators: Implement it as a resource to illustrate valuation methods in the classroom.
What the Template Contains
- Preloaded REFR Data: Historical and projected financial data, including revenue, EBIT, and capital expenditures.
- DCF and WACC Models: Professional-grade sheets for calculating intrinsic value and Weighted Average Cost of Capital.
- Editable Inputs: Yellow-highlighted cells for adjusting revenue growth, tax rates, and discount rates.
- Financial Statements: Comprehensive annual and quarterly financials for deeper analysis.
- Key Ratios: Profitability, leverage, and efficiency ratios to evaluate performance.
- Dashboard and Charts: Visual summaries of valuation outcomes and assumptions.
Disclaimer
All information, articles, and product details provided on this website are for general informational and educational purposes only. We do not claim any ownership over, nor do we intend to infringe upon, any trademarks, copyrights, logos, brand names, or other intellectual property mentioned or depicted on this site. Such intellectual property remains the property of its respective owners, and any references here are made solely for identification or informational purposes, without implying any affiliation, endorsement, or partnership.
We make no representations or warranties, express or implied, regarding the accuracy, completeness, or suitability of any content or products presented. Nothing on this website should be construed as legal, tax, investment, financial, medical, or other professional advice. In addition, no part of this site—including articles or product references—constitutes a solicitation, recommendation, endorsement, advertisement, or offer to buy or sell any securities, franchises, or other financial instruments, particularly in jurisdictions where such activity would be unlawful.
All content is of a general nature and may not address the specific circumstances of any individual or entity. It is not a substitute for professional advice or services. Any actions you take based on the information provided here are strictly at your own risk. You accept full responsibility for any decisions or outcomes arising from your use of this website and agree to release us from any liability in connection with your use of, or reliance upon, the content or products found herein.