
|
Richardson Electronics ، Ltd. (Rell) DCF تقييم |
Fully Editable: Tailor To Your Needs In Excel Or Sheets
Professional Design: Trusted, Industry-Standard Templates
Investor-Approved Valuation Models
MAC/PC Compatible, Fully Unlocked
No Expertise Is Needed; Easy To Follow
Richardson Electronics, Ltd. (RELL) Bundle
اكتشف الإمكانات الحقيقية لـ Richardson Electronics ، Ltd. (Rell) مع حاسبة DCF المتقدمة! اضبط الافتراضات الرئيسية واستكشاف السيناريوهات المختلفة وتقييم كيفية تأثير التغييرات على تقييم Richardson Electronics ، Ltd. (Rell) - كل ذلك ضمن قالب Excel واحد مريح.
What You Will Get
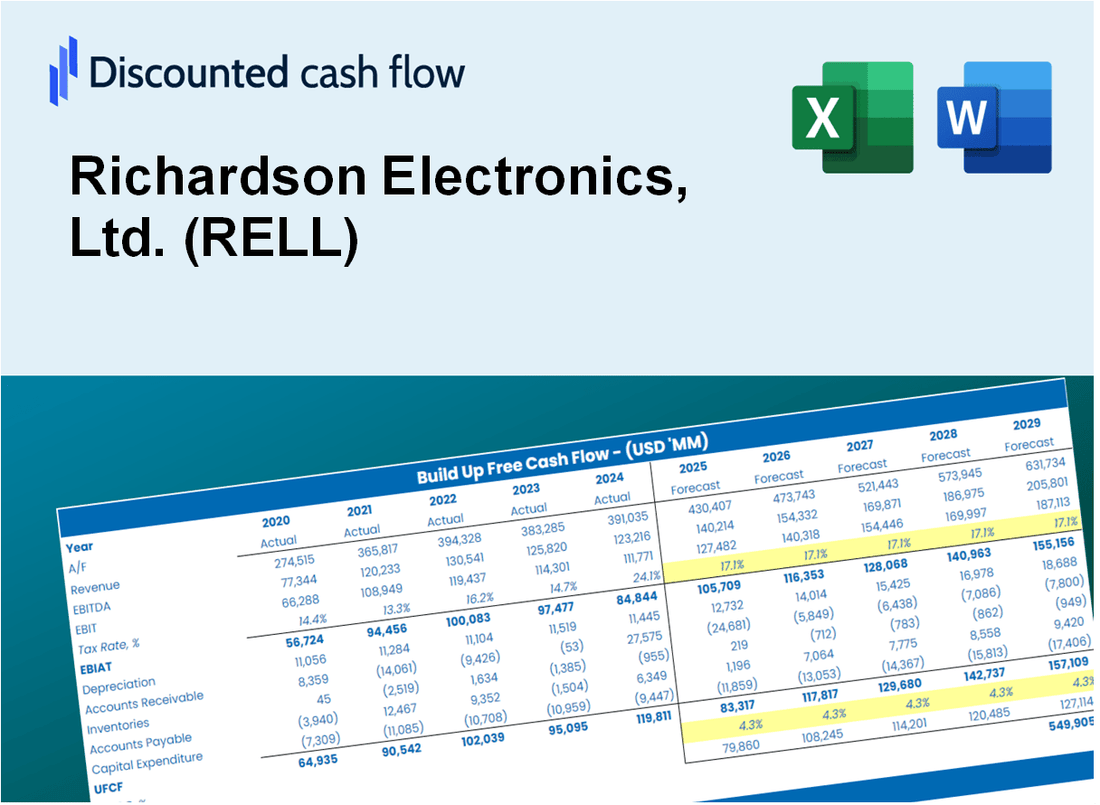
- Genuine Richardson Data: Preloaded financials – from revenue to EBIT – based on actual and projected figures for Richardson Electronics, Ltd. (RELL).
- Complete Customization: Modify all essential parameters (yellow cells) such as WACC, growth %, and tax rates.
- Instant Valuation Updates: Automatic recalculations to evaluate the effect of changes on Richardson Electronics, Ltd.'s (RELL) fair value.
- Flexible Excel Template: Designed for quick modifications, scenario analysis, and comprehensive projections.
- Efficient and Precise: Eliminate the need to build models from the ground up while ensuring accuracy and adaptability.
Key Features
- Accurate Richardson Electronics Financials: Gain access to reliable pre-loaded historical data and future forecasts.
- Adjustable Forecast Parameters: Modify the yellow-highlighted cells such as WACC, growth rates, and profit margins.
- Real-Time Calculations: Automatic recalculations for DCF, Net Present Value (NPV), and cash flow analysis.
- Interactive Visual Dashboard: User-friendly charts and summaries to help you visualize your valuation outcomes.
- Suitable for All Experience Levels: A straightforward, intuitive layout designed for investors, CFOs, and consultants alike.
How It Works
- 1. Open the Template: Download and access the Excel file containing Richardson Electronics, Ltd. (RELL)'s preloaded data.
- 2. Edit Assumptions: Modify essential inputs such as growth rates, WACC, and capital expenditures.
- 3. View Results Instantly: The DCF model automatically calculates the intrinsic value and NPV.
- 4. Test Scenarios: Evaluate various forecasts to explore different valuation outcomes.
- 5. Use with Confidence: Deliver professional valuation insights to enhance your decision-making process.
Why Choose This Calculator for Richardson Electronics, Ltd. (RELL)?
- Designed for Experts: A sophisticated tool tailored for analysts, CFOs, and consultants.
- Accurate Data: Historical and projected financials for Richardson Electronics preloaded for precision.
- Flexible Scenario Analysis: Easily simulate various forecasts and assumptions.
- Comprehensive Outputs: Automatically computes intrinsic value, NPV, and essential metrics.
- User-Friendly: Step-by-step guidance ensures a smooth experience throughout the process.
Who Should Use Richardson Electronics, Ltd. (RELL)?
- Investors: Gain insights and make informed decisions with our advanced market analysis tools.
- Financial Analysts: Streamline your workflow with comprehensive reports tailored for the electronics sector.
- Consultants: Easily modify our resources for impactful client presentations and strategic recommendations.
- Technology Enthusiasts: Enhance your knowledge of the electronics industry with in-depth case studies and analyses.
- Educators and Students: Utilize our materials as a hands-on resource for courses in technology and finance.
What the Template Contains
- Historical Data: Includes Richardson Electronics, Ltd. (RELL)’s past financials and baseline forecasts.
- DCF and Levered DCF Models: Detailed templates to calculate Richardson Electronics, Ltd. (RELL)’s intrinsic value.
- WACC Sheet: Pre-built calculations for Weighted Average Cost of Capital.
- Editable Inputs: Modify key drivers like growth rates, EBITDA %, and CAPEX assumptions.
- Quarterly and Annual Statements: A complete breakdown of Richardson Electronics, Ltd. (RELL)’s financials.
- Interactive Dashboard: Visualize valuation results and projections dynamically.
Disclaimer
All information, articles, and product details provided on this website are for general informational and educational purposes only. We do not claim any ownership over, nor do we intend to infringe upon, any trademarks, copyrights, logos, brand names, or other intellectual property mentioned or depicted on this site. Such intellectual property remains the property of its respective owners, and any references here are made solely for identification or informational purposes, without implying any affiliation, endorsement, or partnership.
We make no representations or warranties, express or implied, regarding the accuracy, completeness, or suitability of any content or products presented. Nothing on this website should be construed as legal, tax, investment, financial, medical, or other professional advice. In addition, no part of this site—including articles or product references—constitutes a solicitation, recommendation, endorsement, advertisement, or offer to buy or sell any securities, franchises, or other financial instruments, particularly in jurisdictions where such activity would be unlawful.
All content is of a general nature and may not address the specific circumstances of any individual or entity. It is not a substitute for professional advice or services. Any actions you take based on the information provided here are strictly at your own risk. You accept full responsibility for any decisions or outcomes arising from your use of this website and agree to release us from any liability in connection with your use of, or reliance upon, the content or products found herein.