
|
Renolds Consumer Products Inc. (REYN) DCF تقييم |
Fully Editable: Tailor To Your Needs In Excel Or Sheets
Professional Design: Trusted, Industry-Standard Templates
Investor-Approved Valuation Models
MAC/PC Compatible, Fully Unlocked
No Expertise Is Needed; Easy To Follow
Reynolds Consumer Products Inc. (REYN) Bundle
عزز استراتيجية الاستثمار الخاصة بك مع حاسبة رينولدز للمنتجات الاستهلاكية (رين) DCF! استكشاف البيانات المالية الحقيقية ، وضبط توقعات النمو والنفقات ، ومراقبة كيفية تأثير الاختلافات على القيمة الجوهرية لـ Reynolds Consumer Products Inc. (REYN) في الوقت الفعلي.
What You Will Get
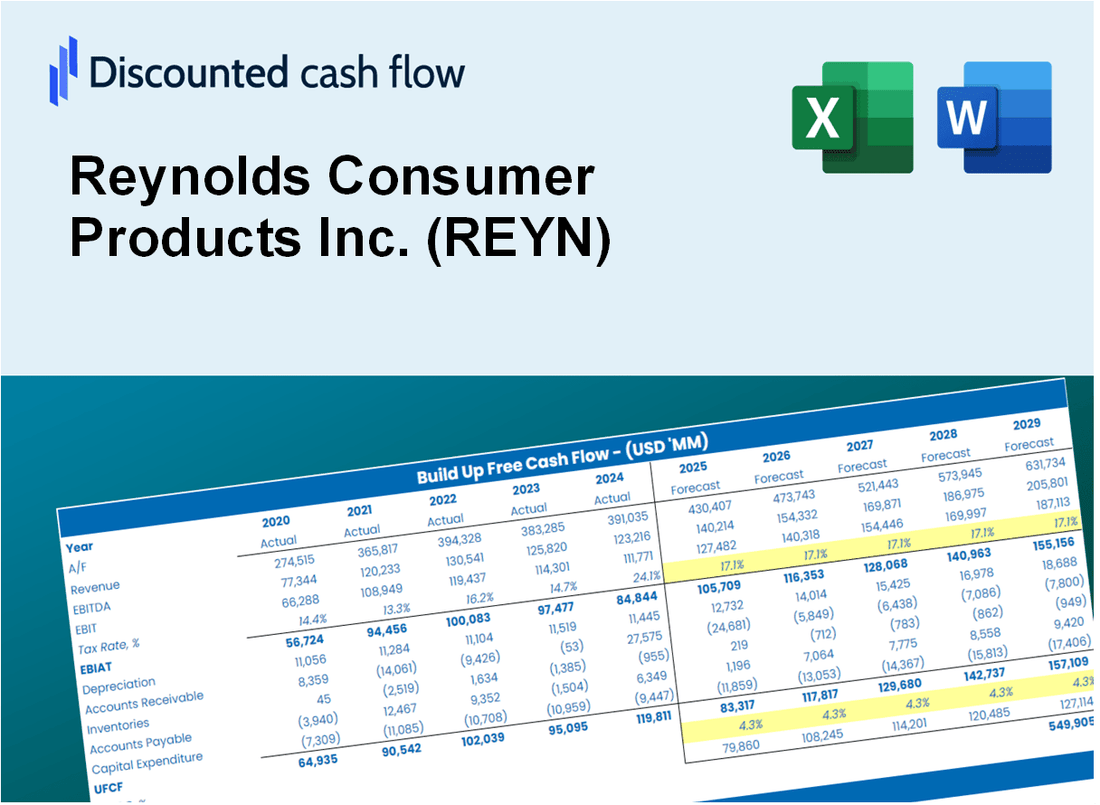
- Editable Excel Template: A fully customizable Excel-based DCF Calculator featuring pre-filled real REYN financials.
- Real-World Data: Historical data and forward-looking estimates (as highlighted in the yellow cells).
- Forecast Flexibility: Modify forecast assumptions such as revenue growth, EBITDA %, and WACC.
- Automatic Calculations: Instantly observe the effects of your inputs on Reynolds Consumer Products' valuation.
- Professional Tool: Designed for investors, CFOs, consultants, and financial analysts.
- User-Friendly Design: Organized for clarity and ease of use, complete with step-by-step instructions.
Key Features
- 🔍 Real-Life REYN Financials: Pre-filled historical and projected data for Reynolds Consumer Products Inc.
- ✏️ Fully Customizable Inputs: Adjust all critical parameters (yellow cells) like WACC, growth %, and tax rates.
- 📊 Professional DCF Valuation: Built-in formulas calculate Reynolds’ intrinsic value using the Discounted Cash Flow method.
- ⚡ Instant Results: Visualize Reynolds’ valuation instantly after making changes.
- Scenario Analysis: Test and compare outcomes for various financial assumptions side-by-side.
How It Works
- Step 1: Download the prebuilt Excel template featuring Reynolds Consumer Products Inc.'s (REYN) data.
- Step 2: Navigate through the pre-filled sheets to grasp the essential metrics.
- Step 3: Modify forecasts and assumptions in the editable yellow cells (WACC, growth, margins).
- Step 4: Instantly see recalculated results, including Reynolds Consumer Products Inc.'s (REYN) intrinsic value.
- Step 5: Make well-informed investment choices or create reports based on the outputs.
Why Choose This Calculator for Reynolds Consumer Products Inc. (REYN)?
- Accuracy: Utilizes real Reynolds financial data to ensure precision.
- Flexibility: Allows users to easily adjust and test various input parameters.
- Time-Saving: Avoid the complexities of creating a DCF model from the ground up.
- Professional-Grade: Crafted with the expertise and usability expected at the CFO level.
- User-Friendly: Intuitive interface designed for users with all levels of financial modeling experience.
Who Should Use This Product?
- Finance Students: Explore practical applications of financial modeling with Reynolds Consumer Products Inc. (REYN).
- Academics: Integrate advanced valuation techniques into your studies or research projects.
- Investors: Validate your investment strategies and evaluate the performance metrics of Reynolds Consumer Products Inc. (REYN).
- Analysts: Optimize your analysis process with a ready-to-use, customizable financial model.
- Small Business Owners: Understand the valuation approaches applied to large public companies like Reynolds Consumer Products Inc. (REYN).
What the Template Contains
- Pre-Filled DCF Model: Reynolds Consumer Products Inc.'s (REYN) financial data preloaded for immediate use.
- WACC Calculator: Detailed calculations for Weighted Average Cost of Capital tailored for Reynolds Consumer Products Inc. (REYN).
- Financial Ratios: Assess Reynolds Consumer Products Inc.'s (REYN) profitability, leverage, and efficiency metrics.
- Editable Inputs: Modify assumptions such as growth rates, margins, and CAPEX to suit your analysis for Reynolds Consumer Products Inc. (REYN).
- Financial Statements: Access annual and quarterly reports for comprehensive analysis of Reynolds Consumer Products Inc. (REYN).
- Interactive Dashboard: Effortlessly visualize key valuation metrics and outcomes for Reynolds Consumer Products Inc. (REYN).
Disclaimer
All information, articles, and product details provided on this website are for general informational and educational purposes only. We do not claim any ownership over, nor do we intend to infringe upon, any trademarks, copyrights, logos, brand names, or other intellectual property mentioned or depicted on this site. Such intellectual property remains the property of its respective owners, and any references here are made solely for identification or informational purposes, without implying any affiliation, endorsement, or partnership.
We make no representations or warranties, express or implied, regarding the accuracy, completeness, or suitability of any content or products presented. Nothing on this website should be construed as legal, tax, investment, financial, medical, or other professional advice. In addition, no part of this site—including articles or product references—constitutes a solicitation, recommendation, endorsement, advertisement, or offer to buy or sell any securities, franchises, or other financial instruments, particularly in jurisdictions where such activity would be unlawful.
All content is of a general nature and may not address the specific circumstances of any individual or entity. It is not a substitute for professional advice or services. Any actions you take based on the information provided here are strictly at your own risk. You accept full responsibility for any decisions or outcomes arising from your use of this website and agree to release us from any liability in connection with your use of, or reliance upon, the content or products found herein.