
|
Repligen Corporation (RGEN) DCF تقييم |
Fully Editable: Tailor To Your Needs In Excel Or Sheets
Professional Design: Trusted, Industry-Standard Templates
Investor-Approved Valuation Models
MAC/PC Compatible, Fully Unlocked
No Expertise Is Needed; Easy To Follow
Repligen Corporation (RGEN) Bundle
اكتشف القيمة الحقيقية لشركة Repligen Corporation (RGEN) مع حاسبة DCF المتقدمة! اضبط الافتراضات الرئيسية ، واستكشاف السيناريوهات المختلفة ، وقم بتقييم كيفية تأثير التغييرات على تقييم شركة Redigen Corporation (RGEN)-كل ذلك ضمن قالب Excel سهل الاستخدام.
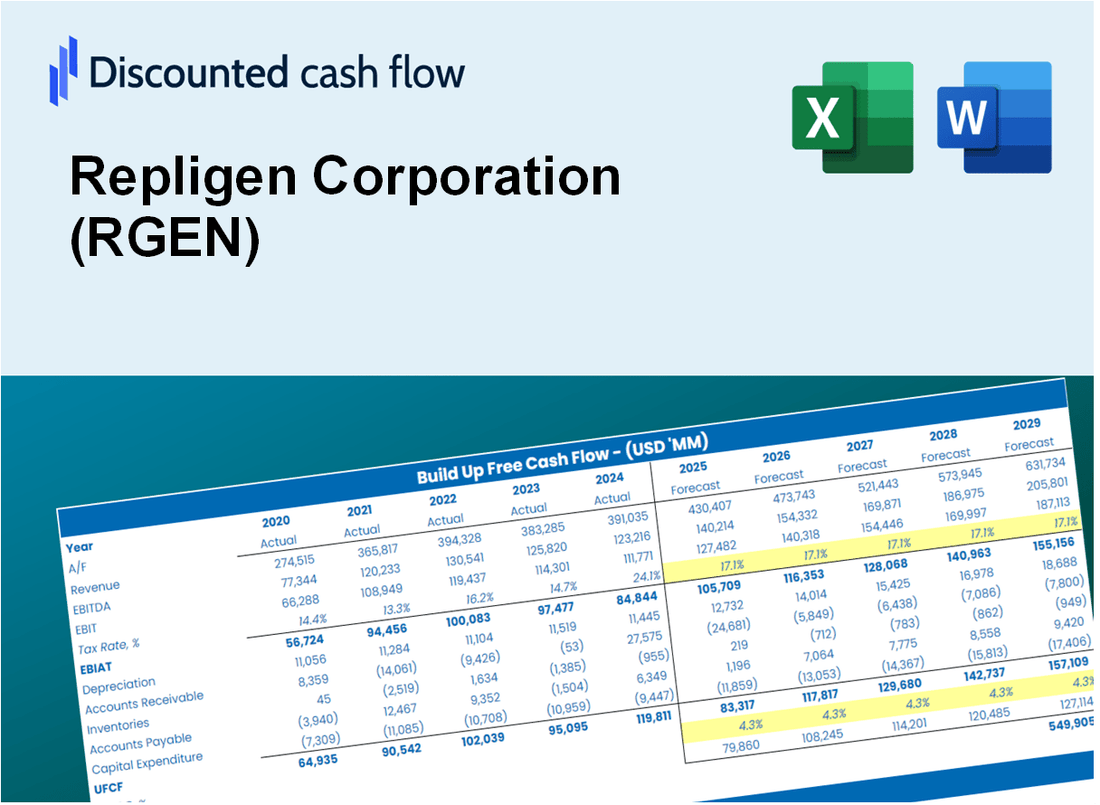
Discounted Cash Flow (DCF) - (USD MM)
| Year | AY1 2020 |
AY2 2021 |
AY3 2022 |
AY4 2023 |
AY5 2024 |
FY1 2025 |
FY2 2026 |
FY3 2027 |
FY4 2028 |
FY5 2029 |
|---|---|---|---|---|---|---|---|---|---|---|
| Revenue | 366.3 | 670.5 | 801.5 | 632.4 | 634.4 | 764.2 | 920.6 | 1,108.9 | 1,335.8 | 1,609.1 |
| Revenue Growth, % | 0 | 83.08 | 19.54 | -21.11 | 0.32845 | 20.46 | 20.46 | 20.46 | 20.46 | 20.46 |
| EBITDA | 101.6 | 211.6 | 246.9 | 127.8 | 82.1 | 188.4 | 226.9 | 273.4 | 329.3 | 396.6 |
| EBITDA, % | 27.75 | 31.55 | 30.81 | 20.2 | 12.94 | 24.65 | 24.65 | 24.65 | 24.65 | 24.65 |
| Depreciation | 27.1 | 38.4 | 51.0 | 68.6 | 86.6 | 67.2 | 81.0 | 97.5 | 117.5 | 141.5 |
| Depreciation, % | 7.39 | 5.73 | 6.36 | 10.84 | 13.64 | 8.79 | 8.79 | 8.79 | 8.79 | 8.79 |
| EBIT | 74.6 | 173.1 | 195.9 | 59.2 | -4.5 | 121.2 | 146.0 | 175.8 | 211.8 | 255.1 |
| EBIT, % | 20.36 | 25.82 | 24.45 | 9.36 | -0.70314 | 15.86 | 15.86 | 15.86 | 15.86 | 15.86 |
| Total Cash | 717.3 | 603.8 | 623.8 | 751.3 | 757.4 | 715.1 | 861.4 | 1,037.7 | 1,250.0 | 1,505.7 |
| Total Cash, percent | .0 | .0 | .0 | .0 | .0 | .0 | .0 | .0 | .0 | .0 |
| Account Receivables | 71.4 | 117.4 | 116.2 | 124.2 | 134.1 | 141.0 | 169.9 | 204.7 | 246.5 | 297.0 |
| Account Receivables, % | 19.49 | 17.51 | 14.5 | 19.63 | 21.14 | 18.46 | 18.46 | 18.46 | 18.46 | 18.46 |
| Inventories | 95.0 | 184.5 | 238.3 | 202.3 | 143.0 | 210.5 | 253.6 | 305.4 | 367.9 | 443.2 |
| Inventories, % | 25.94 | 27.51 | 29.73 | 31.99 | 22.53 | 27.54 | 27.54 | 27.54 | 27.54 | 27.54 |
| Accounts Payable | 16.9 | 36.2 | 27.6 | 19.6 | 32.1 | 33.0 | 39.8 | 47.9 | 57.7 | 69.5 |
| Accounts Payable, % | 4.61 | 5.4 | 3.44 | 3.09 | 5.06 | 4.32 | 4.32 | 4.32 | 4.32 | 4.32 |
| Capital Expenditure | -26.3 | -71.3 | -133.3 | -39.0 | -32.9 | -70.0 | -84.3 | -101.6 | -122.4 | -147.4 |
| Capital Expenditure, % | -7.19 | -10.63 | -16.64 | -6.17 | -5.19 | -9.16 | -9.16 | -9.16 | -9.16 | -9.16 |
| Tax Rate, % | 5.63 | 5.63 | 5.63 | 5.63 | 5.63 | 5.63 | 5.63 | 5.63 | 5.63 | 5.63 |
| EBITAT | 75.4 | 144.6 | 166.3 | 37.2 | -4.2 | 103.1 | 124.2 | 149.7 | 180.3 | 217.2 |
| Depreciation | ||||||||||
| Changes in Account Receivables | ||||||||||
| Changes in Inventories | ||||||||||
| Changes in Accounts Payable | ||||||||||
| Capital Expenditure | ||||||||||
| UFCF | -73.4 | -4.4 | 22.7 | 86.8 | 111.4 | 26.7 | 55.7 | 67.1 | 80.8 | 97.3 |
| WACC, % | 8.67 | 8.62 | 8.63 | 8.56 | 8.65 | 8.63 | 8.63 | 8.63 | 8.63 | 8.63 |
| PV UFCF | ||||||||||
| SUM PV UFCF | 246.5 | |||||||||
| Long Term Growth Rate, % | 4.00 | |||||||||
| Free cash flow (T + 1) | 101 | |||||||||
| Terminal Value | 2,188 | |||||||||
| Present Terminal Value | 1,447 | |||||||||
| Enterprise Value | 1,693 | |||||||||
| Net Debt | -71 | |||||||||
| Equity Value | 1,764 | |||||||||
| Diluted Shares Outstanding, MM | 56 | |||||||||
| Equity Value Per Share | 31.54 |
What You Will Receive
- Adjustable Forecast Inputs: Effortlessly modify assumptions (growth %, margins, WACC) to explore various scenarios.
- Real-World Data: Repligen Corporation’s financial data pre-loaded to facilitate your analysis.
- Automated DCF Outputs: The template computes Net Present Value (NPV) and intrinsic value for you.
- Customizable and Professional: A refined Excel model that caters to your valuation requirements.
- Designed for Analysts and Investors: Perfect for evaluating projections, confirming strategies, and enhancing efficiency.
Key Features
- Comprehensive RGEN Data: Pre-loaded with Repligen’s historical financial performance and future forecasts.
- Customizable Assumptions: Modify revenue growth rates, profit margins, discount rates, tax implications, and capital investments.
- Interactive Valuation Framework: Automatically recalculates Net Present Value (NPV) and intrinsic value based on your specifications.
- Scenario Analysis: Develop various forecasting scenarios to evaluate different valuation results.
- Intuitive Interface: Designed for ease of use, catering to both seasoned professionals and newcomers.
How It Works
- 1. Download the Template: Obtain and open the Excel file with Repligen Corporation’s (RGEN) preloaded data.
- 2. Adjust Key Inputs: Modify essential parameters such as growth rates, WACC, and capital expenditures.
- 3. Instant Results: The DCF model automatically computes intrinsic value and NPV in real-time.
- 4. Explore Different Scenarios: Evaluate various forecasts to understand different valuation results.
- 5. Present with Assurance: Deliver professional valuation analysis to back your strategic decisions.
Why Choose This Calculator for Repligen Corporation (RGEN)?
- Accurate Data: Up-to-date Repligen financials provide dependable valuation outcomes.
- Customizable: Modify essential parameters such as growth rates, WACC, and tax rates to align with your forecasts.
- Time-Saving: Pre-configured calculations save you the hassle of starting from the ground up.
- Professional-Grade Tool: Tailored for investors, analysts, and consultants in the biotech sector.
- User-Friendly: Easy-to-navigate interface and clear instructions make it accessible for all users.
Who Should Use This Product?
- Investors: Evaluate Repligen Corporation’s (RGEN) market position before making investment decisions.
- CFOs and Financial Analysts: Optimize valuation methodologies and assess financial forecasts for Repligen Corporation.
- Startup Founders: Discover the valuation strategies employed by established companies like Repligen Corporation.
- Consultants: Provide comprehensive valuation analyses and reports for clients interested in Repligen Corporation.
- Students and Educators: Utilize real-time data from Repligen Corporation to enhance learning and teaching of valuation practices.
What the Template Contains
- Historical Data: Includes Repligen Corporation’s past financials and baseline forecasts.
- DCF and Levered DCF Models: Detailed templates to calculate Repligen Corporation’s intrinsic value.
- WACC Sheet: Pre-built calculations for Weighted Average Cost of Capital.
- Editable Inputs: Modify key drivers like growth rates, EBITDA %, and CAPEX assumptions.
- Quarterly and Annual Statements: A complete breakdown of Repligen Corporation’s financials.
- Interactive Dashboard: Visualize valuation results and projections dynamically.
Disclaimer
All information, articles, and product details provided on this website are for general informational and educational purposes only. We do not claim any ownership over, nor do we intend to infringe upon, any trademarks, copyrights, logos, brand names, or other intellectual property mentioned or depicted on this site. Such intellectual property remains the property of its respective owners, and any references here are made solely for identification or informational purposes, without implying any affiliation, endorsement, or partnership.
We make no representations or warranties, express or implied, regarding the accuracy, completeness, or suitability of any content or products presented. Nothing on this website should be construed as legal, tax, investment, financial, medical, or other professional advice. In addition, no part of this site—including articles or product references—constitutes a solicitation, recommendation, endorsement, advertisement, or offer to buy or sell any securities, franchises, or other financial instruments, particularly in jurisdictions where such activity would be unlawful.
All content is of a general nature and may not address the specific circumstances of any individual or entity. It is not a substitute for professional advice or services. Any actions you take based on the information provided here are strictly at your own risk. You accept full responsibility for any decisions or outcomes arising from your use of this website and agree to release us from any liability in connection with your use of, or reliance upon, the content or products found herein.