
|
ستورم ، روجر & Company ، Inc. (RGR) تقييم DCF |
Fully Editable: Tailor To Your Needs In Excel Or Sheets
Professional Design: Trusted, Industry-Standard Templates
Investor-Approved Valuation Models
MAC/PC Compatible, Fully Unlocked
No Expertise Is Needed; Easy To Follow
Sturm, Ruger & Company, Inc. (RGR) Bundle
تقييم التوقعات المالية لـ Sturm ، Ruger & Company ، Inc. (RGR) مع الخبرة! توفر حاسبة DCF (RGR) هذه البيانات المالية المليئة مسبقًا والتخصيص الكامل لتعديل نمو الإيرادات ، WACC ، الهوامش ، وغيرها من الافتراضات الأساسية التي تتماشى مع توقعاتك.
What You Will Get
- Editable Excel Template: A fully customizable Excel-based DCF Calculator featuring pre-filled real RGR financials.
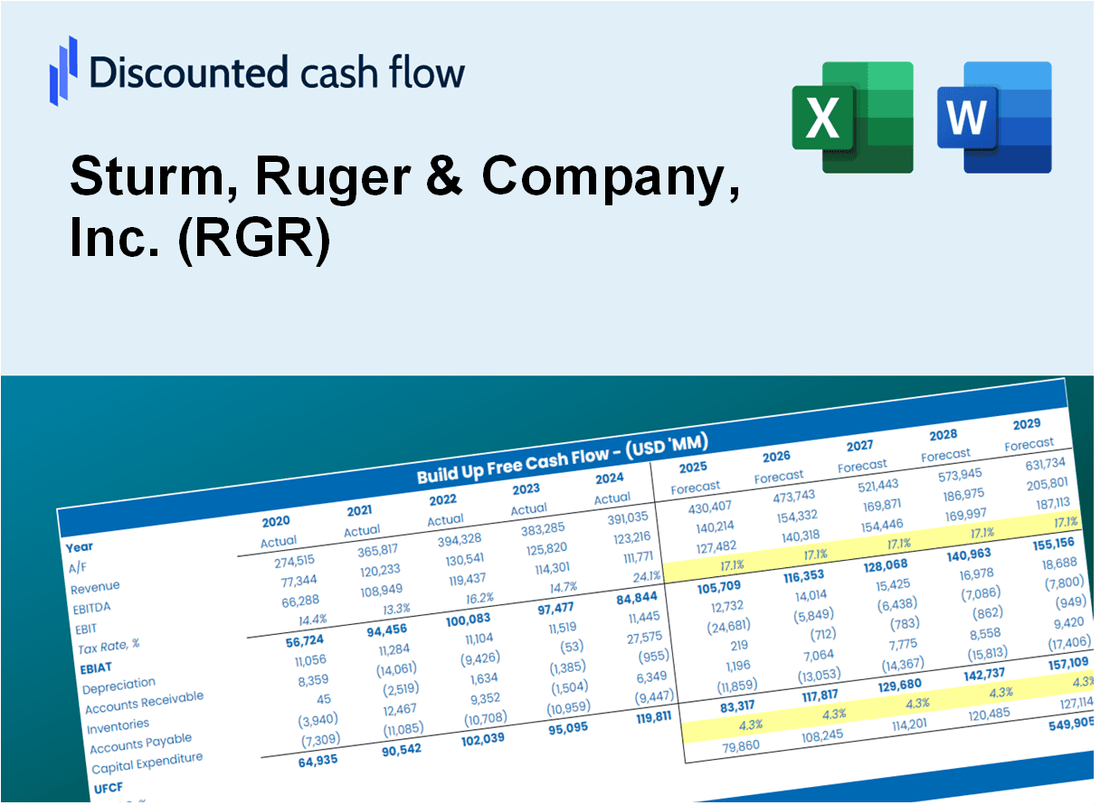
- Real-World Data: Historical data and forward-looking estimates (as showcased in the highlighted cells).
- Forecast Flexibility: Adjust forecast assumptions such as revenue growth, EBITDA %, and WACC.
- Automatic Calculations: Instantly observe the effect of your inputs on Sturm, Ruger & Company’s valuation.
- Professional Tool: Designed for investors, CFOs, consultants, and financial analysts.
- User-Friendly Design: Organized for clarity and ease of use, complete with step-by-step guidance.
Key Features
- Real-Life RGR Data: Pre-filled with Sturm, Ruger & Company’s historical financials and future projections.
- Fully Customizable Inputs: Modify revenue growth, profit margins, WACC, tax rates, and capital expenditures.
- Dynamic Valuation Model: Automatic updates to Net Present Value (NPV) and intrinsic value based on user inputs.
- Scenario Testing: Develop multiple forecast scenarios to evaluate various valuation outcomes.
- User-Friendly Design: Intuitive, organized, and crafted for both professionals and novices.
How It Works
- Download the Template: Gain immediate access to the Excel-based RGR DCF Calculator.
- Input Your Assumptions: Modify the yellow-highlighted cells for growth rates, WACC, margins, and other key factors.
- Instant Calculations: The model automatically calculates Sturm, Ruger & Company’s intrinsic value.
- Test Scenarios: Experiment with various assumptions to assess potential changes in valuation.
- Analyze and Decide: Utilize the results to inform your investment or financial decisions.
Why Choose This Calculator for Sturm, Ruger & Company, Inc. (RGR)?
- Designed for Experts: A sophisticated tool utilized by financial analysts, CFOs, and industry consultants.
- Comprehensive Data: Sturm, Ruger's historical and projected financials are preloaded to ensure precision.
- Flexible Scenario Analysis: Effortlessly simulate various forecasts and assumptions.
- Intuitive Outputs: Automatically computes intrinsic value, NPV, and essential metrics.
- User-Friendly: Detailed step-by-step instructions to navigate the calculator seamlessly.
Who Should Use This Product?
- Professional Investors: Develop comprehensive and trustworthy valuation models for analyzing Sturm, Ruger & Company, Inc. (RGR).
- Corporate Finance Teams: Evaluate valuation scenarios to inform strategic decisions within the organization.
- Consultants and Advisors: Deliver precise valuation insights for clients interested in Sturm, Ruger & Company, Inc. (RGR).
- Students and Educators: Utilize real-world data to enhance learning and practice in financial modeling.
- Firearms Industry Enthusiasts: Gain insights into how companies like Sturm, Ruger & Company, Inc. (RGR) are valued in the market.
What the Template Contains
- Pre-Filled Data: Includes Sturm, Ruger & Company, Inc.'s (RGR) historical financials and forecasts.
- Discounted Cash Flow Model: Editable DCF valuation model with automatic calculations.
- Weighted Average Cost of Capital (WACC): A dedicated sheet for calculating WACC based on custom inputs.
- Key Financial Ratios: Analyze Sturm, Ruger & Company, Inc.'s (RGR) profitability, efficiency, and leverage.
- Customizable Inputs: Edit revenue growth, margins, and tax rates with ease.
- Clear Dashboard: Charts and tables summarizing key valuation results.
Disclaimer
All information, articles, and product details provided on this website are for general informational and educational purposes only. We do not claim any ownership over, nor do we intend to infringe upon, any trademarks, copyrights, logos, brand names, or other intellectual property mentioned or depicted on this site. Such intellectual property remains the property of its respective owners, and any references here are made solely for identification or informational purposes, without implying any affiliation, endorsement, or partnership.
We make no representations or warranties, express or implied, regarding the accuracy, completeness, or suitability of any content or products presented. Nothing on this website should be construed as legal, tax, investment, financial, medical, or other professional advice. In addition, no part of this site—including articles or product references—constitutes a solicitation, recommendation, endorsement, advertisement, or offer to buy or sell any securities, franchises, or other financial instruments, particularly in jurisdictions where such activity would be unlawful.
All content is of a general nature and may not address the specific circumstances of any individual or entity. It is not a substitute for professional advice or services. Any actions you take based on the information provided here are strictly at your own risk. You accept full responsibility for any decisions or outcomes arising from your use of this website and agree to release us from any liability in connection with your use of, or reliance upon, the content or products found herein.