
|
Raymond James Financial ، Inc. (RJF) DCF تقييم |
Fully Editable: Tailor To Your Needs In Excel Or Sheets
Professional Design: Trusted, Industry-Standard Templates
Investor-Approved Valuation Models
MAC/PC Compatible, Fully Unlocked
No Expertise Is Needed; Easy To Follow
Raymond James Financial, Inc. (RJF) Bundle
كمستثمر أو محلل ، فإن حاسبة DCF [RJF] هذه هي المورد المثالي للتقييم الدقيق. مجهزة ببيانات حقيقية من Raymond James Financial ، Inc. ، يمكنك ضبط التنبؤات ومراقبة الآثار على الفور.
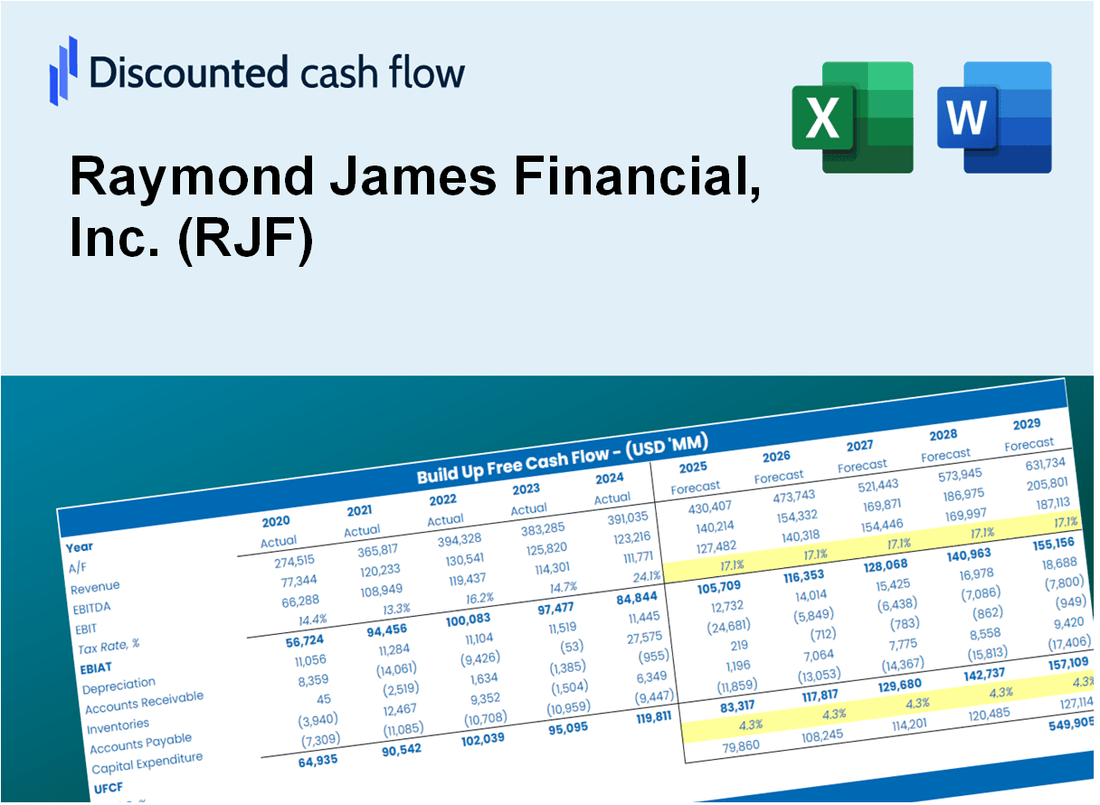
Discounted Cash Flow (DCF) - (USD MM)
| Year | AY1 2020 |
AY2 2021 |
AY3 2022 |
AY4 2023 |
AY5 2024 |
FY1 2025 |
FY2 2026 |
FY3 2027 |
FY4 2028 |
FY5 2029 |
|---|---|---|---|---|---|---|---|---|---|---|
| Revenue | 7,889.0 | 9,780.0 | 11,156.0 | 12,841.0 | 14,741.0 | 17,244.8 | 20,173.8 | 23,600.3 | 27,608.8 | 32,298.1 |
| Revenue Growth, % | 0 | 23.97 | 14.07 | 15.1 | 14.8 | 16.98 | 16.98 | 16.98 | 16.98 | 16.98 |
| EBITDA | 1,322.0 | 1,925.0 | 2,281.0 | 2,445.0 | 2,822.0 | 3,279.0 | 3,835.9 | 4,487.4 | 5,249.6 | 6,141.3 |
| EBITDA, % | 16.76 | 19.68 | 20.45 | 19.04 | 19.14 | 19.01 | 19.01 | 19.01 | 19.01 | 19.01 |
| Depreciation | 119.0 | 134.0 | 145.0 | 165.0 | 179.0 | 230.3 | 269.4 | 315.2 | 368.7 | 431.3 |
| Depreciation, % | 1.51 | 1.37 | 1.3 | 1.28 | 1.21 | 1.34 | 1.34 | 1.34 | 1.34 | 1.34 |
| EBIT | 1,203.0 | 1,791.0 | 2,136.0 | 2,280.0 | 2,643.0 | 3,048.7 | 3,566.5 | 4,172.2 | 4,880.9 | 5,709.9 |
| EBIT, % | 15.25 | 18.31 | 19.15 | 17.76 | 17.93 | 17.68 | 17.68 | 17.68 | 17.68 | 17.68 |
| Total Cash | 13,975.0 | 15,516.0 | 15,989.0 | 18,472.0 | 19,247.0 | 17,244.8 | 20,173.8 | 23,600.3 | 27,608.8 | 32,298.1 |
| Total Cash, percent | .0 | .0 | .0 | .0 | .0 | .0 | .0 | .0 | .0 | .0 |
| Account Receivables | 3,362.0 | 3,830.0 | 4,549.0 | 4,133.0 | 4,536.0 | 6,398.2 | 7,484.9 | 8,756.2 | 10,243.5 | 11,983.3 |
| Account Receivables, % | 42.62 | 39.16 | 40.78 | 32.19 | 30.77 | 37.1 | 37.1 | 37.1 | 37.1 | 37.1 |
| Inventories | .0 | .0 | .0 | .0 | .0 | .0 | .0 | .0 | .0 | .0 |
| Inventories, % | 0 | 0 | 0 | 0 | 0 | 0 | 0 | 0 | 0 | 0 |
| Accounts Payable | 6,792.0 | 13,991.0 | 11,446.0 | 5,447.0 | 5,825.0 | 12,693.1 | 14,849.1 | 17,371.2 | 20,321.7 | 23,773.3 |
| Accounts Payable, % | 86.09 | 143.06 | 102.6 | 42.42 | 39.52 | 73.61 | 73.61 | 73.61 | 73.61 | 73.61 |
| Capital Expenditure | -124.0 | -74.0 | -91.0 | -173.0 | -205.0 | -202.9 | -237.3 | -277.6 | -324.8 | -380.0 |
| Capital Expenditure, % | -1.57 | -0.75665 | -0.8157 | -1.35 | -1.39 | -1.18 | -1.18 | -1.18 | -1.18 | -1.18 |
| Tax Rate, % | 21.76 | 21.76 | 21.76 | 21.76 | 21.76 | 21.76 | 21.76 | 21.76 | 21.76 | 21.76 |
| EBITAT | 935.4 | 1,403.0 | 1,594.1 | 1,739.0 | 2,068.0 | 2,348.9 | 2,747.9 | 3,214.6 | 3,760.6 | 4,399.4 |
| Depreciation | ||||||||||
| Changes in Account Receivables | ||||||||||
| Changes in Inventories | ||||||||||
| Changes in Accounts Payable | ||||||||||
| Capital Expenditure | ||||||||||
| UFCF | 4,360.4 | 8,194.0 | -1,615.9 | -3,852.0 | 2,017.0 | 7,382.3 | 3,849.2 | 4,503.0 | 5,267.8 | 6,162.5 |
| WACC, % | 11.91 | 11.94 | 11.74 | 11.83 | 11.94 | 11.87 | 11.87 | 11.87 | 11.87 | 11.87 |
| PV UFCF | ||||||||||
| SUM PV UFCF | 19,771.1 | |||||||||
| Long Term Growth Rate, % | 2.00 | |||||||||
| Free cash flow (T + 1) | 6,286 | |||||||||
| Terminal Value | 63,680 | |||||||||
| Present Terminal Value | 36,343 | |||||||||
| Enterprise Value | 56,114 | |||||||||
| Net Debt | -6,971 | |||||||||
| Equity Value | 63,085 | |||||||||
| Diluted Shares Outstanding, MM | 212 | |||||||||
| Equity Value Per Share | 297.15 |
What You Will Get
- Editable Forecast Inputs: Easily modify assumptions (growth %, margins, WACC) to explore various scenarios.
- Real-World Data: Raymond James Financial’s financial data pre-filled to kickstart your analysis.
- Automatic DCF Outputs: The template computes Net Present Value (NPV) and intrinsic value automatically.
- Customizable and Professional: A refined Excel model that adjusts to your valuation requirements.
- Built for Analysts and Investors: Perfect for evaluating projections, confirming strategies, and enhancing efficiency.
Key Features
- Comprehensive Data: Raymond James Financial's historical financial statements and pre-filled forecasts.
- Customizable Inputs: Modify WACC, tax rates, revenue growth, and EBITDA margins as needed.
- Real-Time Updates: Monitor Raymond James Financial's intrinsic value recalculating instantly.
- Intuitive Visual Outputs: Dashboard graphs showcase valuation results and essential metrics.
- Designed for Precision: A sophisticated tool tailored for analysts, investors, and finance professionals.
How It Works
- Step 1: Download the Excel file.
- Step 2: Review Raymond James Financial's pre-filled financial data and forecasts.
- Step 3: Modify key inputs such as revenue growth, WACC, and tax rates (highlighted cells).
- Step 4: Observe the DCF model update in real-time as you adjust your assumptions.
- Step 5: Analyze the outputs and leverage the results for your investment strategies.
Why Choose This Calculator?
- Accuracy: Reliable Raymond James financials ensure precise data.
- Flexibility: Tailored for users to easily experiment and adjust inputs.
- Time-Saving: Eliminate the need to create a DCF model from the ground up.
- Professional-Grade: Crafted with CFO-level expertise and user experience in focus.
- User-Friendly: Intuitive design makes it accessible for users with varying levels of financial modeling skills.
Who Should Use This Product?
- Professional Investors: Develop comprehensive and accurate financial models for investment analysis in Raymond James Financial, Inc. (RJF).
- Corporate Finance Teams: Evaluate financial scenarios to inform strategic decisions within their organizations.
- Consultants and Advisors: Deliver precise financial insights and recommendations regarding Raymond James Financial, Inc. (RJF) to clients.
- Students and Educators: Utilize real-world data to enhance learning and practice in financial modeling and analysis.
- Finance Enthusiasts: Gain a deeper understanding of how financial institutions like Raymond James Financial, Inc. (RJF) are assessed in the market.
What the Template Contains
- Comprehensive DCF Model: Editable template featuring detailed valuation calculations for Raymond James Financial, Inc. (RJF).
- Real-World Data: Historical and projected financials for Raymond James Financial, Inc. (RJF) preloaded for in-depth analysis.
- Customizable Parameters: Modify WACC, growth rates, and tax assumptions to explore various scenarios.
- Financial Statements: Complete annual and quarterly breakdowns for enhanced insights into performance.
- Key Ratios: Integrated analysis for profitability, efficiency, and leverage metrics.
- Dashboard with Visual Outputs: Interactive charts and tables providing clear, actionable insights.
Disclaimer
All information, articles, and product details provided on this website are for general informational and educational purposes only. We do not claim any ownership over, nor do we intend to infringe upon, any trademarks, copyrights, logos, brand names, or other intellectual property mentioned or depicted on this site. Such intellectual property remains the property of its respective owners, and any references here are made solely for identification or informational purposes, without implying any affiliation, endorsement, or partnership.
We make no representations or warranties, express or implied, regarding the accuracy, completeness, or suitability of any content or products presented. Nothing on this website should be construed as legal, tax, investment, financial, medical, or other professional advice. In addition, no part of this site—including articles or product references—constitutes a solicitation, recommendation, endorsement, advertisement, or offer to buy or sell any securities, franchises, or other financial instruments, particularly in jurisdictions where such activity would be unlawful.
All content is of a general nature and may not address the specific circumstances of any individual or entity. It is not a substitute for professional advice or services. Any actions you take based on the information provided here are strictly at your own risk. You accept full responsibility for any decisions or outcomes arising from your use of this website and agree to release us from any liability in connection with your use of, or reliance upon, the content or products found herein.