
|
Relay Therapeutics ، Inc. (Rlay) DCF تقييم |
Fully Editable: Tailor To Your Needs In Excel Or Sheets
Professional Design: Trusted, Industry-Standard Templates
Investor-Approved Valuation Models
MAC/PC Compatible, Fully Unlocked
No Expertise Is Needed; Easy To Follow
Relay Therapeutics, Inc. (RLAY) Bundle
اكتسب نظرة ثاقبة على شركة Relay Therapeutics، Inc. (RLAY) تحليل التقييم باستخدام حاسبة DCF المتطورة لدينا! مزودًا ببيانات حقيقية لـ (RLAY)، يتيح لك نموذج Excel هذا ضبط التوقعات والافتراضات لتحديد القيمة الجوهرية لشركة Relay Therapeutics، Inc.
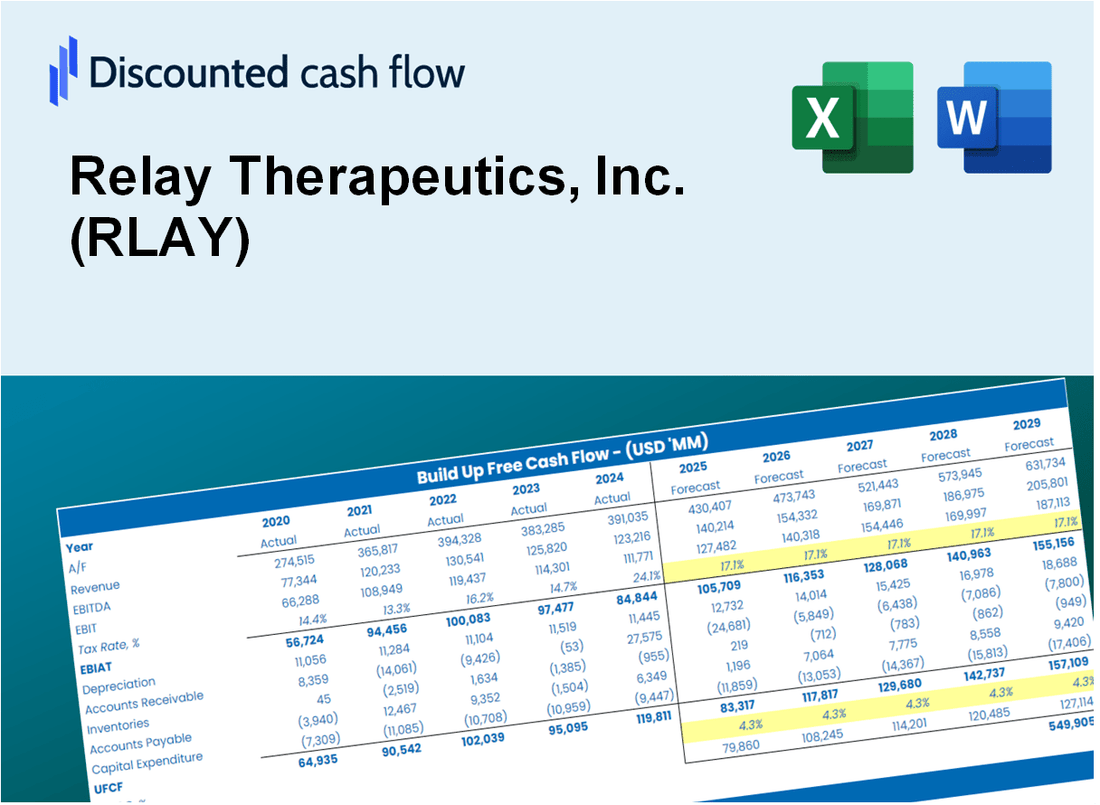
Discounted Cash Flow (DCF) - (USD MM)
| Year | AY1 2020 |
AY2 2021 |
AY3 2022 |
AY4 2023 |
AY5 2024 |
FY1 2025 |
FY2 2026 |
FY3 2027 |
FY4 2028 |
FY5 2029 |
|---|---|---|---|---|---|---|---|---|---|---|
| Revenue | 82.7 | 3.0 | 1.4 | 25.5 | 10.0 | 7.2 | 5.2 | 3.8 | 2.7 | 2.0 |
| Revenue Growth, % | 0 | -96.34 | -54.41 | 1749.82 | -60.83 | -27.89 | -27.89 | -27.89 | -27.89 | -27.89 |
| EBITDA | -52.2 | -223.1 | -306.8 | -374.2 | -380.2 | -6.7 | -4.8 | -3.5 | -2.5 | -1.8 |
| EBITDA, % | -63.21 | -7364.87 | -22217.38 | -1464.62 | -3799.44 | -92.64 | -92.64 | -92.64 | -92.64 | -92.64 |
| Depreciation | 3.5 | 3.9 | 4.1 | 5.3 | 5.5 | 4.0 | 2.9 | 2.1 | 1.5 | 1.1 |
| Depreciation, % | 4.29 | 129.58 | 299.06 | 20.63 | 54.6 | 55.9 | 55.9 | 55.9 | 55.9 | 55.9 |
| EBIT | -55.8 | -227.0 | -311.0 | -379.4 | -385.7 | -6.7 | -4.9 | -3.5 | -2.5 | -1.8 |
| EBIT, % | -67.51 | -7494.45 | -22516.44 | -1485.25 | -3854.04 | -93.5 | -93.5 | -93.5 | -93.5 | -93.5 |
| Total Cash | 678.1 | 958.1 | 998.9 | 750.1 | 781.3 | 7.2 | 5.2 | 3.8 | 2.7 | 2.0 |
| Total Cash, percent | .0 | .0 | .1 | .0 | .0 | .0 | .0 | .0 | .0 | .0 |
| Account Receivables | 82.7 | 4.9 | 5.2 | .0 | .0 | 4.3 | 3.1 | 2.3 | 1.6 | 1.2 |
| Account Receivables, % | 100 | 163.09 | 377.91 | 0 | 0 | 60 | 60 | 60 | 60 | 60 |
| Inventories | .0 | -682.5 | 12.1 | .0 | .0 | .0 | .0 | .0 | .0 | .0 |
| Inventories, % | 0 | -22531.89 | 876.9 | 0 | 0 | 0 | 0 | 0 | 0 | 0 |
| Accounts Payable | 6.4 | 8.3 | 10.6 | 9.2 | 14.1 | 5.0 | 3.6 | 2.6 | 1.9 | 1.3 |
| Accounts Payable, % | 7.68 | 273.23 | 765.97 | 36.06 | 140.87 | 68.75 | 68.75 | 68.75 | 68.75 | 68.75 |
| Capital Expenditure | -1.9 | -3.5 | -9.1 | -4.1 | -2.0 | -3.4 | -2.5 | -1.8 | -1.3 | -.9 |
| Capital Expenditure, % | -2.34 | -114.59 | -656.19 | -16.15 | -20.17 | -47.73 | -47.73 | -47.73 | -47.73 | -47.73 |
| Tax Rate, % | 0 | 0 | 0 | 0 | 0 | 0 | 0 | 0 | 0 | 0 |
| EBITAT | -55.8 | -227.0 | -311.0 | -379.4 | -385.7 | -6.7 | -4.9 | -3.5 | -2.5 | -1.8 |
| Depreciation | ||||||||||
| Changes in Account Receivables | ||||||||||
| Changes in Inventories | ||||||||||
| Changes in Accounts Payable | ||||||||||
| Capital Expenditure | ||||||||||
| UFCF | -130.5 | 535.6 | -1,008.5 | -362.3 | -377.3 | -19.6 | -4.6 | -3.3 | -2.4 | -1.7 |
| WACC, % | 10.55 | 10.55 | 10.55 | 10.55 | 10.55 | 10.55 | 10.55 | 10.55 | 10.55 | 10.55 |
| PV UFCF | ||||||||||
| SUM PV UFCF | -26.6 | |||||||||
| Long Term Growth Rate, % | 2.00 | |||||||||
| Free cash flow (T + 1) | -2 | |||||||||
| Terminal Value | -21 | |||||||||
| Present Terminal Value | -13 | |||||||||
| Enterprise Value | -39 | |||||||||
| Net Debt | -76 | |||||||||
| Equity Value | 37 | |||||||||
| Diluted Shares Outstanding, MM | 143 | |||||||||
| Equity Value Per Share | 0.26 |
What You Will Get
- Real RLAY Financial Data: Pre-filled with Relay Therapeutics’ historical and projected data for precise analysis.
- Fully Editable Template: Modify key inputs like revenue growth, WACC, and EBITDA % with ease.
- Automatic Calculations: See Relay Therapeutics’ intrinsic value update instantly based on your changes.
- Professional Valuation Tool: Designed for investors, analysts, and consultants seeking accurate DCF results.
- User-Friendly Design: Simple structure and clear instructions for all experience levels.
Key Features
- Real-Life RLAY Data: Pre-filled with Relay Therapeutics’ historical financials and future projections.
- Fully Customizable Inputs: Modify revenue growth, margins, WACC, tax rates, and capital expenditures to fit your analysis.
- Dynamic Valuation Model: Automatic recalculations of Net Present Value (NPV) and intrinsic value based on your parameters.
- Scenario Testing: Develop multiple forecasting scenarios to evaluate various valuation results.
- User-Friendly Design: Intuitive, organized, and crafted for both professionals and newcomers.
How It Works
- Step 1: Download the prebuilt Excel template featuring Relay Therapeutics, Inc.'s (RLAY) data.
- Step 2: Navigate through the pre-filled sheets to familiarize yourself with the essential metrics.
- Step 3: Modify forecasts and assumptions in the editable yellow cells (WACC, growth, margins).
- Step 4: Instantly see the recalculated results, including Relay Therapeutics, Inc.'s (RLAY) intrinsic value.
- Step 5: Utilize the outputs to make informed investment decisions or create detailed reports.
Why Choose This Calculator?
- User-Friendly Interface: Perfectly crafted for both novices and seasoned professionals.
- Customizable Inputs: Adjust parameters effortlessly to suit your financial analysis.
- Real-Time Feedback: Watch as Relay Therapeutics’ (RLAY) valuation updates instantly with your changes.
- Preloaded Data: Comes equipped with Relay Therapeutics’ actual financial metrics for swift evaluations.
- Endorsed by Experts: A go-to tool for investors and analysts aiming for well-informed choices.
Who Should Use This Product?
- Healthcare Professionals: Understand drug development processes and apply them to real-world scenarios.
- Researchers: Integrate advanced modeling techniques into studies or clinical trials.
- Investors: Evaluate your investment strategies and analyze the performance metrics for Relay Therapeutics, Inc. (RLAY).
- Pharmaceutical Analysts: Enhance your analysis with a tailored, comprehensive DCF model specific to biotech.
- Entrepreneurs: Discover how biotech companies like Relay Therapeutics, Inc. (RLAY) are assessed in the market.
What the Template Contains
- Preloaded RLAY Data: Historical and projected financial data, including revenue, EBIT, and capital expenditures.
- DCF and WACC Models: Professional-grade sheets for calculating intrinsic value and Weighted Average Cost of Capital.
- Editable Inputs: Yellow-highlighted cells for adjusting revenue growth, tax rates, and discount rates.
- Financial Statements: Comprehensive annual and quarterly financials for deeper analysis.
- Key Ratios: Profitability, leverage, and efficiency ratios to evaluate performance.
- Dashboard and Charts: Visual summaries of valuation outcomes and assumptions.
Disclaimer
All information, articles, and product details provided on this website are for general informational and educational purposes only. We do not claim any ownership over, nor do we intend to infringe upon, any trademarks, copyrights, logos, brand names, or other intellectual property mentioned or depicted on this site. Such intellectual property remains the property of its respective owners, and any references here are made solely for identification or informational purposes, without implying any affiliation, endorsement, or partnership.
We make no representations or warranties, express or implied, regarding the accuracy, completeness, or suitability of any content or products presented. Nothing on this website should be construed as legal, tax, investment, financial, medical, or other professional advice. In addition, no part of this site—including articles or product references—constitutes a solicitation, recommendation, endorsement, advertisement, or offer to buy or sell any securities, franchises, or other financial instruments, particularly in jurisdictions where such activity would be unlawful.
All content is of a general nature and may not address the specific circumstances of any individual or entity. It is not a substitute for professional advice or services. Any actions you take based on the information provided here are strictly at your own risk. You accept full responsibility for any decisions or outcomes arising from your use of this website and agree to release us from any liability in connection with your use of, or reliance upon, the content or products found herein.