
|
Rockwell Medical ، Inc. (RMTI) DCF تقييم |
Fully Editable: Tailor To Your Needs In Excel Or Sheets
Professional Design: Trusted, Industry-Standard Templates
Investor-Approved Valuation Models
MAC/PC Compatible, Fully Unlocked
No Expertise Is Needed; Easy To Follow
Rockwell Medical, Inc. (RMTI) Bundle
تبسيط تحليلك وتحسين الدقة مع حاسبة (RMTI) DCF! مزودة ببيانات حقيقية من Rockwell Medical ، Inc. والافتراضات القابلة للتخصيص ، تمكنك هذه الأداة من التنبؤ وتحليل وتقييم (RMTI) تمامًا مثل المستثمر المحنك.
What You Will Get
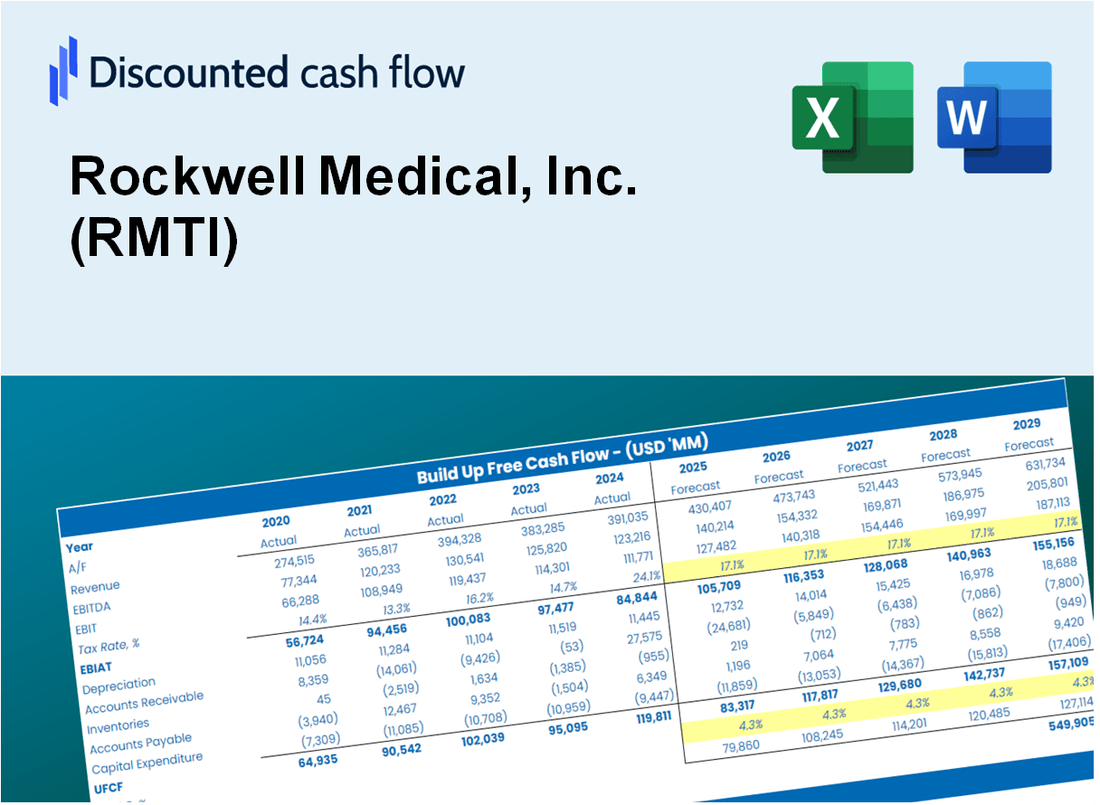
- Pre-Filled Financial Model: Rockwell Medical's actual data facilitates accurate DCF valuation.
- Full Forecast Control: Modify revenue growth, margins, WACC, and other essential drivers.
- Instant Calculations: Automatic updates provide immediate results as adjustments are made.
- Investor-Ready Template: A polished Excel file crafted for professional-level valuation.
- Customizable and Reusable: Designed for versatility, enabling repeated use for comprehensive forecasts.
Key Features
- 🔍 Real-Life RMTI Financials: Pre-filled historical and projected data for Rockwell Medical, Inc.
- ✏️ Fully Customizable Inputs: Adjust all critical parameters (yellow cells) like WACC, growth %, and tax rates.
- 📊 Professional DCF Valuation: Built-in formulas calculate Rockwell Medical’s intrinsic value using the Discounted Cash Flow method.
- ⚡ Instant Results: Visualize Rockwell Medical’s valuation instantly after making changes.
- Scenario Analysis: Test and compare outcomes for various financial assumptions side-by-side.
How It Works
- 1. Access the Template: Download and open the Excel file containing Rockwell Medical, Inc.'s (RMTI) preloaded data.
- 2. Adjust Key Inputs: Modify essential parameters such as growth projections, WACC, and capital expenditures.
- 3. Get Instant Results: The DCF model automatically computes intrinsic value and NPV in real-time.
- 4. Explore Different Scenarios: Analyze various forecasts to evaluate different valuation results.
- 5. Present with Assurance: Deliver professional valuation insights to enhance your decision-making process.
Why Choose This Calculator for Rockwell Medical, Inc. (RMTI)?
- Comprehensive Tool: Offers DCF, WACC, and financial ratio analyses tailored for RMTI.
- Customizable Inputs: Modify the highlighted cells to explore different financial scenarios.
- Detailed Insights: Automatically computes Rockwell Medical’s intrinsic value and Net Present Value.
- Preloaded Data: Access historical and projected data for a reliable analysis foundation.
- Professional Quality: Perfect for financial analysts, investors, and business consultants focusing on RMTI.
Who Should Use This Product?
- Healthcare Professionals: Understand the latest treatment options and clinical data related to Rockwell Medical's therapies.
- Researchers: Utilize advanced models to analyze the efficacy of Rockwell Medical's products in clinical studies.
- Investors: Evaluate your investment strategies and assess the market potential of Rockwell Medical (RMTI).
- Pharmaceutical Analysts: Enhance your analysis with a comprehensive overview of Rockwell Medical's financial health and market position.
- Patients and Caregivers: Learn about the innovative solutions provided by Rockwell Medical and their impact on patient care.
What the Template Contains
- Historical Data: Includes Rockwell Medical’s past financials and baseline forecasts.
- DCF and Levered DCF Models: Detailed templates to calculate Rockwell Medical’s intrinsic value.
- WACC Sheet: Pre-built calculations for Weighted Average Cost of Capital.
- Editable Inputs: Modify key drivers like growth rates, EBITDA %, and CAPEX assumptions.
- Quarterly and Annual Statements: A complete breakdown of Rockwell Medical’s financials.
- Interactive Dashboard: Visualize valuation results and projections dynamically.
Disclaimer
All information, articles, and product details provided on this website are for general informational and educational purposes only. We do not claim any ownership over, nor do we intend to infringe upon, any trademarks, copyrights, logos, brand names, or other intellectual property mentioned or depicted on this site. Such intellectual property remains the property of its respective owners, and any references here are made solely for identification or informational purposes, without implying any affiliation, endorsement, or partnership.
We make no representations or warranties, express or implied, regarding the accuracy, completeness, or suitability of any content or products presented. Nothing on this website should be construed as legal, tax, investment, financial, medical, or other professional advice. In addition, no part of this site—including articles or product references—constitutes a solicitation, recommendation, endorsement, advertisement, or offer to buy or sell any securities, franchises, or other financial instruments, particularly in jurisdictions where such activity would be unlawful.
All content is of a general nature and may not address the specific circumstances of any individual or entity. It is not a substitute for professional advice or services. Any actions you take based on the information provided here are strictly at your own risk. You accept full responsibility for any decisions or outcomes arising from your use of this website and agree to release us from any liability in connection with your use of, or reliance upon, the content or products found herein.