
|
Transcode Therapeutics ، Inc. (RNAZ) DCF تقييم |
Fully Editable: Tailor To Your Needs In Excel Or Sheets
Professional Design: Trusted, Industry-Standard Templates
Investor-Approved Valuation Models
MAC/PC Compatible, Fully Unlocked
No Expertise Is Needed; Easy To Follow
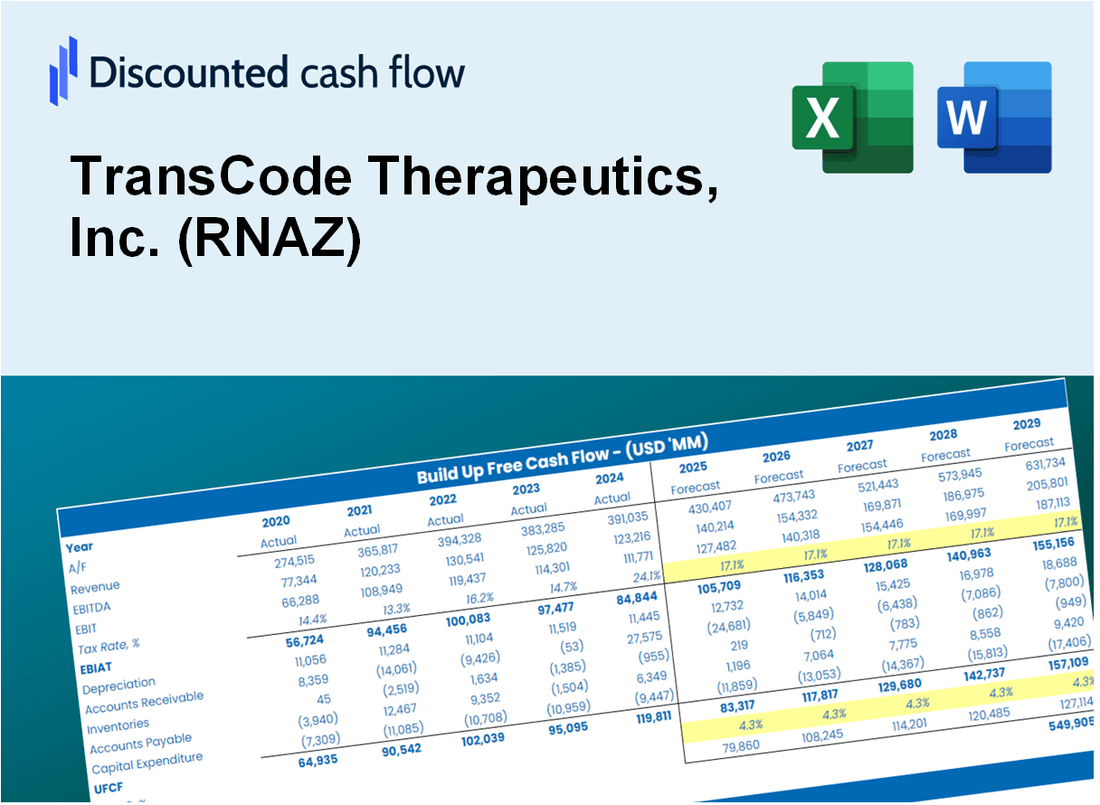
TransCode Therapeutics, Inc. (RNAZ) Bundle
تبحث لتقييم القيمة الجوهرية لـ Transcode Therapeutics ، Inc.؟ يدمج حاسبة RNAZ DCF الخاصة بنا بيانات العالم الحقيقي مع ميزات تخصيص واسعة ، مما يتيح لك تحسين التنبؤات وتعزيز استراتيجيات الاستثمار الخاصة بك.
Discounted Cash Flow (DCF) - (USD MM)
| Year | AY1 2020 |
AY2 2021 |
AY3 2022 |
AY4 2023 |
AY5 2024 |
FY1 2025 |
FY2 2026 |
FY3 2027 |
FY4 2028 |
FY5 2029 |
|---|---|---|---|---|---|---|---|---|---|---|
| Revenue | .0 | .0 | .0 | .0 | .0 | .0 | .0 | .0 | .0 | .0 |
| Revenue Growth, % | 0 | 0 | 0 | 0 | 0 | 0 | 0 | 0 | 0 | 0 |
| EBITDA | .0 | -6.1 | -17.5 | -18.0 | -16.2 | .0 | .0 | .0 | .0 | .0 |
| EBITDA, % | 100 | 100 | 100 | 100 | 100 | 100 | 100 | 100 | 100 | 100 |
| Depreciation | .7 | .0 | .1 | .5 | .5 | .0 | .0 | .0 | .0 | .0 |
| Depreciation, % | 100 | 100 | 100 | 100 | 100 | 100 | 100 | 100 | 100 | 100 |
| EBIT | -.7 | -6.2 | -17.6 | -18.5 | -16.7 | .0 | .0 | .0 | .0 | .0 |
| EBIT, % | 100 | 100 | 100 | 100 | 100 | 100 | 100 | 100 | 100 | 100 |
| Total Cash | .8 | 20.8 | 5.0 | 2.8 | 5.8 | .0 | .0 | .0 | .0 | .0 |
| Total Cash, percent | .0 | .0 | .0 | .0 | .0 | .0 | .0 | .0 | .0 | .0 |
| Account Receivables | .0 | .0 | .4 | .0 | .0 | .0 | .0 | .0 | .0 | .0 |
| Account Receivables, % | 100 | 100 | 100 | 100 | 100 | 100 | 100 | 100 | 100 | 100 |
| Inventories | .0 | .0 | .6 | .0 | .0 | .0 | .0 | .0 | .0 | .0 |
| Inventories, % | 100 | 100 | 100 | 100 | 100 | 100 | 100 | 100 | 100 | 100 |
| Accounts Payable | .0 | 2.0 | 4.1 | .0 | 2.6 | .0 | .0 | .0 | .0 | .0 |
| Accounts Payable, % | 100 | 100 | 100 | 100 | 100 | 100 | 100 | 100 | 100 | 100 |
| Capital Expenditure | .0 | -.3 | -.1 | .0 | .0 | .0 | .0 | .0 | .0 | .0 |
| Capital Expenditure, % | 100 | 100 | 100 | 100 | 100 | 0 | 0 | 0 | 0 | 0 |
| Tax Rate, % | 0.18231 | 0.18231 | 0.18231 | 0.18231 | 0.18231 | 0.18231 | 0.18231 | 0.18231 | 0.18231 | 0.18231 |
| EBITAT | -.8 | -6.2 | -35.1 | -18.5 | -16.7 | .0 | .0 | .0 | .0 | .0 |
| Depreciation | ||||||||||
| Changes in Account Receivables | ||||||||||
| Changes in Inventories | ||||||||||
| Changes in Accounts Payable | ||||||||||
| Capital Expenditure | ||||||||||
| UFCF | -.1 | -4.4 | -33.9 | -21.2 | -13.6 | -2.6 | .0 | .0 | .0 | .0 |
| WACC, % | 11.62 | 11.62 | 11.62 | 11.62 | 11.62 | 11.62 | 11.62 | 11.62 | 11.62 | 11.62 |
| PV UFCF | ||||||||||
| SUM PV UFCF | -2.3 | |||||||||
| Long Term Growth Rate, % | 2.00 | |||||||||
| Free cash flow (T + 1) | 0 | |||||||||
| Terminal Value | 0 | |||||||||
| Present Terminal Value | 0 | |||||||||
| Enterprise Value | -2 | |||||||||
| Net Debt | -6 | |||||||||
| Equity Value | 3 | |||||||||
| Diluted Shares Outstanding, MM | 0 | |||||||||
| Equity Value Per Share | 9.73 |
What You Will Get
- Pre-Filled Financial Model: TransCode Therapeutics, Inc. (RNAZ) provides actual data for accurate DCF valuation.
- Full Forecast Control: Modify revenue growth, profit margins, WACC, and other essential drivers.
- Instant Calculations: Automatic updates ensure you see results in real-time as you make adjustments.
- Investor-Ready Template: A polished Excel file crafted for high-quality valuation presentations.
- Customizable and Reusable: Designed for adaptability, enabling ongoing use for comprehensive forecasts.
Key Features
- Comprehensive Data: TransCode Therapeutics' historical financial statements and pre-filled projections.
- Customizable Inputs: Adjust WACC, tax rates, revenue growth, and EBITDA margins as needed.
- Real-Time Results: Monitor TransCode's intrinsic value recalculating instantly.
- Intuitive Visual Outputs: Dashboard charts illustrate valuation results and essential metrics.
- Designed for Precision: A professional-grade tool for analysts, investors, and finance professionals.
How It Works
- Step 1: Download the prebuilt Excel template featuring TransCode Therapeutics, Inc. (RNAZ) data.
- Step 2: Review the pre-filled sheets to familiarize yourself with the essential metrics.
- Step 3: Modify forecasts and assumptions in the editable yellow cells (WACC, growth, margins).
- Step 4: Instantly see the recalculated results, including TransCode Therapeutics, Inc.'s (RNAZ) intrinsic value.
- Step 5: Make well-informed investment decisions or create reports based on the generated outputs.
Why Choose TransCode Therapeutics, Inc. (RNAZ)?
- Innovative Solutions: Pioneering RNA-based therapies that target unmet medical needs.
- Expertise in RNA Technology: A dedicated team with extensive experience in RNA therapeutics enhances reliability.
- Robust Research Pipeline: A diverse array of projects aimed at transforming cancer treatment.
- Commitment to Quality: Rigorous testing and validation processes ensure high standards in all developments.
- Industry Recognition: A trusted name among investors and healthcare professionals in the biopharmaceutical sector.
Who Should Use This Product?
- Biotech Investors: Develop comprehensive and accurate valuation models for assessing RNAZ investments.
- Corporate Strategy Teams: Evaluate valuation scenarios to inform strategic decisions within the biotech sector.
- Consultants and Advisors: Deliver precise valuation insights for clients interested in TransCode Therapeutics (RNAZ).
- Students and Educators: Utilize real-world data to enhance learning and practice in financial modeling related to biotech.
- Pharmaceutical Enthusiasts: Gain insights into how biotech companies like TransCode Therapeutics (RNAZ) are valued in the market.
What the Template Contains
- Historical Data: Includes TransCode Therapeutics, Inc.'s (RNAZ) past financials and baseline forecasts.
- DCF and Levered DCF Models: Detailed templates to calculate TransCode Therapeutics, Inc.'s (RNAZ) intrinsic value.
- WACC Sheet: Pre-built calculations for Weighted Average Cost of Capital.
- Editable Inputs: Modify key drivers like growth rates, EBITDA %, and CAPEX assumptions.
- Quarterly and Annual Statements: A complete breakdown of TransCode Therapeutics, Inc.'s (RNAZ) financials.
- Interactive Dashboard: Visualize valuation results and projections dynamically.
Disclaimer
All information, articles, and product details provided on this website are for general informational and educational purposes only. We do not claim any ownership over, nor do we intend to infringe upon, any trademarks, copyrights, logos, brand names, or other intellectual property mentioned or depicted on this site. Such intellectual property remains the property of its respective owners, and any references here are made solely for identification or informational purposes, without implying any affiliation, endorsement, or partnership.
We make no representations or warranties, express or implied, regarding the accuracy, completeness, or suitability of any content or products presented. Nothing on this website should be construed as legal, tax, investment, financial, medical, or other professional advice. In addition, no part of this site—including articles or product references—constitutes a solicitation, recommendation, endorsement, advertisement, or offer to buy or sell any securities, franchises, or other financial instruments, particularly in jurisdictions where such activity would be unlawful.
All content is of a general nature and may not address the specific circumstances of any individual or entity. It is not a substitute for professional advice or services. Any actions you take based on the information provided here are strictly at your own risk. You accept full responsibility for any decisions or outcomes arising from your use of this website and agree to release us from any liability in connection with your use of, or reliance upon, the content or products found herein.